Microsoft Edge’s Many Processes

Chromium-based browsers like Microsoft Edge use a multi-process architecture for reliability and security reasons.

tl;dr

For reliability, Process isolation means that if one process crashes, the entire browser need not go down. For example, if a page on leaky.com has a memory leak that’s so bad that its tab crashes with an out-of-memory error, your other tabs remain functional.

For security, Process Isolation means that each processes’ sandbox can be tailored to the minimal privileges needed for its task, ensuring that in the event of a compromise, the badness is limited to the privileges of that processes’ sandbox. A renderer sandbox cannot read or write files on your disk, for example.

Additionally, Process Isolation enables isolating data by site, such that if a tab at evil.com manages to get arbitrary native code execution (allowing it to read all of the memory in its own process), content from another site (e.g. good.com) is in a different process and thus not accessible to steal.

A blog post from 2020 helps explain what each of Edge’s processes is used for.

You can view all of the active processes in the browser’s task manager, opened by hitting Shift+Esc (or on the system menu shown after hitting Alt+Spacebar):

The new Windows 11 Task Manager exposes similar process detail information from Microsoft Edge. (The API mechanisms used to expose the enhanced process purpose information to the task manager are not yet documented.)

Beyond the information shown in the Task Managers, you can also see information about the security restrictions used to sandbox each process by visiting edge://sandbox:

-Eric

Great Bug Reports via “Recreate My Problem” in Microsoft Edge

When you encounter a problem in Microsoft Edge, you can let the team know about it using the … Menu > Help and Feedback > Send Feedback command.

Clicking this menu item will open Edge’s feedback wizard, which provides tons of options about what information will be submitted along with your bug report. Generally speaking, the more data you provide, the more likely it is that we will be able to resolve the problem you encountered.

  • A good description of the problem (What happened? What did you expect?) is the basis of a good feedback report.
  • If you omit or alter the URL of the page with a problem, it can make it almost impossible for us to do anything about it.
  • If you omit your email address, we won’t be able to contact you to share a workaround or ask for more information.
  • Diagnostic data is often very useful for helping to understand what browser configuration choices (installed extensions, configured permissions, Enterprise policies, etc) might be impacting your scenario.
  • A picture is worth a thousand words, so a screenshot is super-useful for helping us understand what you’re seeing.

The most complete and useful feedback report is one with a Recreate my problem trace attached to it. This trace allows you to reproduce the problem while recording a video of your tab (or screen) and a network trace.

To add the repro trace, click the Recreate my problem button at the bottom of the feedback screen:

…or click the diagnostic data link and click the Recreate my problem tab.

Tick the checkbox to indicate that you understand that the capture is likely to contain personal data (which will be transmitted and stored securely by Microsoft), and then click the Start recording button:

A prompt will appear to allow you to select which portion of the screen to record. You can either choose to record the whole screen, the Edge window (use this one to report problems in the browser’s menus/toolbars/etc) or just the tab exhibiting a problem:

Then, go back to the tab and reproduce the problem you encountered. After doing so, return to the feedback window and choose Stop Recording and Save and Include.

If you later change your mind and want to remove the video or network traffic log before submitting your feedback report, you can do so using the Remove links shown on the Recreate my problem screen.

Finally, click the Send button on your feedback report. Your report will be securely uploaded to Microsoft over HTTPS and will be placed in our secure bug-reporting database. Triage teams will soon examine your report, attempting to reproduce and root cause the problem so that we can fix it for you and everyone else in an update to Microsoft Edge.

Thanks for your help!

-Eric

View-Source

Chromium offers two ways for an end-user to view the source code of a web page: 1) the Developer Tools, and 2) The longstanding view-source viewer. Of these, the Developer Tools have received almost all of the attention over the last decade, but in this post I want to take a quick look at the older view-source feature.

To get to the View Page Source feature, you can use the the Ctrl+U keyboard shortcut, the View page source context menu item, or add view-source: prefix before a URL in the omnibox. No matter what mechanism you use, you’ll get a new tab containing a simple view of the original source code of the page, not the current document’s DOM (which may have been extensively modified by script or the user).

Implementation

Over the years, I’ve landed a few fixes to the View-Source code, including security fixes and user-experience fixes (e.g. support for rendering Dark Mode). The feature doesn’t get a lot of love, but its implementation is interesting. Why?

First, let’s start with the URL. Chromium uses a BrowserURLHandler to rewrite all URLs with a view-source: prefix by stripping off the prefix; a VirtualUrl is set on the navigation entry so the user continues to see the view-source prefix in the omnibox, even as the renderer uses the inner url as the source location:

If the user tries to use view-source against an unsupported scheme like javascript:, the rewriter changes the inner url to about:blank.

If the user invokes View page source on a given document, the WebContents’ ViewSource() function takes the current document’s URL, slaps a view-source: prefix on the front, massages a few things, and opens the resulting URL in a new tab.

Most interestingly, View Source is implemented as a mode for a Document loaded inside Blink– you simply call SetIsViewSource(true) on the Document, and then the ComputeDocumentType sets things up such that the CreateDocument() function creates a HTMLViewSourceDocument instead of a plain HTMLDocument. The ViewSource document uses a simpler parser and it does not do much beyond adding markup to display basic color highlighting on HTML elements and their attributes. The resulting “source-formatted” HTML is displayed as text to the user.

Deprecation?

Generally, products try not to expose multiple features to achieve the same task, especially when they use different code to do it. For a while, the View-Source viewer had some unique features that justified its existence; e.g. it integrated with the XSS Auditor to mark blocks of code that the Auditor had deemed reflected XSS attacks:

However, the XSS Auditor was removed more than two years ago. Similarly, many years ago, a site could link directly to a view-source URL (e.g. a HTML tutorial website might do this), but that capability was removed in 2016 for security reasons.

Nowadays, the viewer offers a subset of the features of the Developer Tools’ Sources tab. The Sources tab offers several cool features, including Pretty Print, red-underlines for script errors, and the ability to switch between all of the sources used by the currently loaded page:

The Elements tab is different than both the Sources tab and the view-source viewer because it reflects the current state of the DOM of the currently-loaded page– modifications made to the page by JavaScript are shown in the Elements tab.

At this point, you might naturally wonder why the old viewer still exists.

Part of the answer is “Well, it’s been there forever, and doesn’t cost too much to maintain.” It’s been proposed that perhaps the CTRL+U shortcut should just open the Developer Tools’ Sources tab. However, there are some non-obvious reasons that the old viewer continues to live on:

  1. For Chromium on Android1, adding the view-source prefix in the omnibox is the only convenient way to view source without first tethering your device to a DevTools instance running on a desktop PC.
  2. The HTMLViewSourceDocument code that makes up the bulk of the feature cannot be deleted because the default XML rendering view depends upon it.

    If the user navigates to an XML file that lacks an XSLT, the XML parser calls GetDocument()->SetIsViewSource(true); which results in the browser rendering the plain XML as a document tree:

May the Source be with you!

-Eric

1 Unfortunately, Chromium on iOS doesn’t support either view-source or the Developer Tools. If the iOS browser syncs a view-source url from another platform, the prefix is simply stripped off.

Spooky: Enhancing Dark Mode in Chromium

I am not really a fan of Dark Mode — I like my screens bright and shiny. But it’s October, and it’s sometimes fun to make things dark and spooky.

Some users of my Show Browser Version extension wanted it to better support Dark Mode– the default text colors didn’t work well when the browser frame was black. I landed a simple change to select bright text colors when the browser is in Dark Mode and called it done.

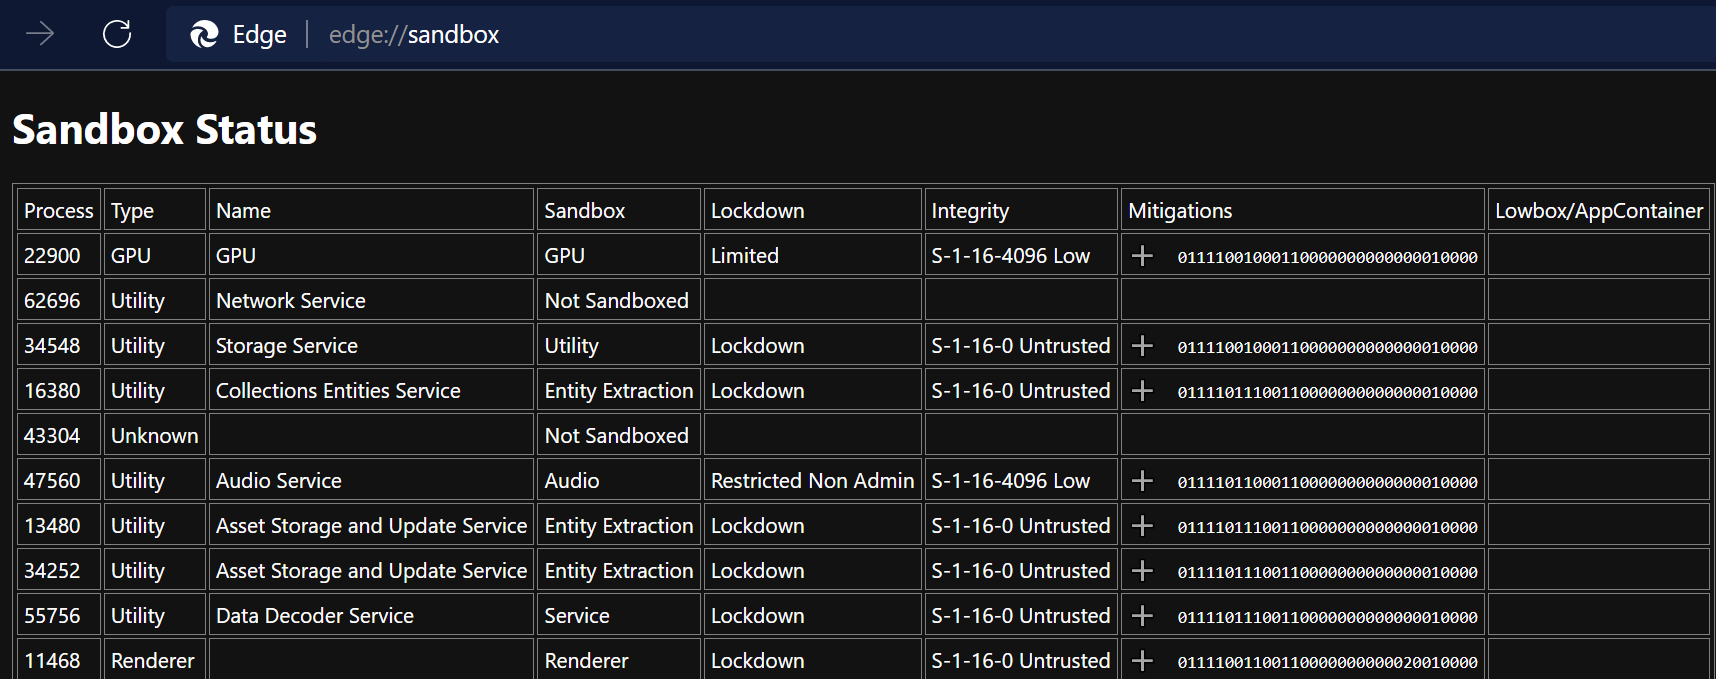
However, after testing my updates, I lazily left my Dev Channel browser in Dark Mode. Over the following months, I noticed that a surprising number of Chromium’s built-in pages were still rendering in brilliant white. Encountering a bright white screen after surfing around in dark mode can be jarring, to say the least.

I wondered how hard it would be to fix some of these pages. The answer, it turns out, is “it’s mostly trivial.”

To indicate that a page supports dark mode styling, simply add a color-scheme meta tag to the head section of the HTML:

<meta name="color-scheme" content="light dark">

Alternatively, add the following rule to the CSS:

:root {
  color-scheme: light dark;
}

Either change alone is enough for simple pages to render nicely in Dark Mode.

However, many pages use more colors than just the default text and background color, so new colors to be used in Dark Mode must be selected. To adjust colors based on the dark mode preference, use the prefers-color-scheme media query to override the default color in your stylesheet. For example:

#tab-list a:hover {
  color: white;
}

@media (prefers-color-scheme: dark) {
  #tab-list a:hover {
    color: black;
  }
}

Tip: Use CSS Variables for Dynamic Updates

When I first updated the about:Net-Internals page, I added dark mode detection and colors to a JavaScript function used to temporarily highlight a div:

function highlightFade(element) {
  const isDarkMode = 
      window.matchMedia('(prefers-color-scheme: dark)').matches;
  element.style.transitionProperty = 'background-color';
  element.style.transitionDuration = '0s';
  element.style.backgroundColor = 
               isDarkMode ? '#03DCB0' : '#fffccf';
  setTimeout(function() {
    element.style.transitionDuration = '1s';
    element.style.backgroundColor = 
               isDarkMode ? '#121212' : '#fff';
  }, 0);
}

However, I noticed a downside to this approach– if I changed my OS color theme from Light to Dark after this function had run without reloading the page, the old white (#fff) background color lingered on the div— it didn’t update to dark like the rest of the background of the page.

The fix was to specify the light and dark colors using CSS Variables within the stylesheet:

 :root {
  --color-active-tab: black;
  --color-background: #fff;
  --color-highlight: #fffccf;
}

@media (prefers-color-scheme: dark) {
  :root {
    --color-active-tab: white;
    --color-background: #121212;
    --color-highlight:  #03DCB0;
  }
}

…and update the JavaScript function to reference them:

function highlightFade(element) {
  element.style.transitionProperty = 'background-color';
  element.style.transitionDuration = '0s';
  element.style.backgroundColor = "var(--color-highlight)";
  setTimeout(function() {
    element.style.transitionDuration = '1s';
    element.style.backgroundColor = "var(--color-background)";
  }, 0);
}

Now, as the OS switches between light/dark, the CSS variable is recalculated and the colors in the page are updated automatically.

Tip: UA Stylesheets are Special

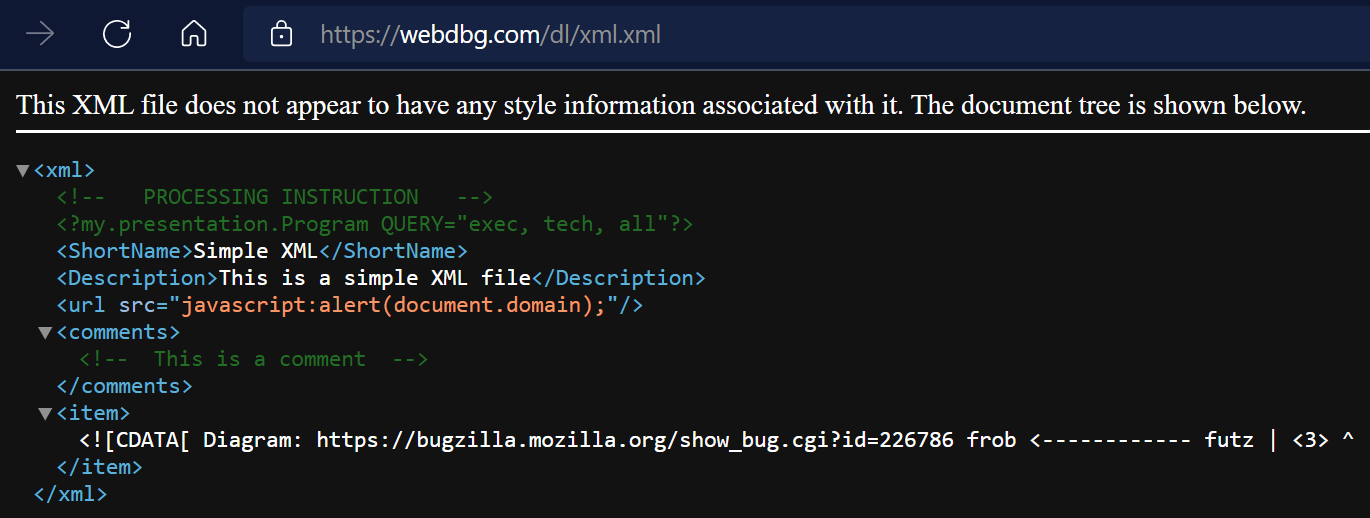
Updating Chromium’s View-Source to support Dark Mode was a bit trickier, because the styles used in View-Source rendering come from a User-Agent stylesheet. Unlike a regular stylesheet, UA Stylesheets’ support for Media Queries is very limited, and prefers-color-scheme is not allowed.

The solution turns out to be pretty simple: instead of using a media query, we express colors using a special (only usable in UA Stylesheets) function, LightDarkValuePair that returns one of its two color arguments based on whether light or dark theme is in use:

color: -internal-light-dark(#00e, rgb(159, 180, 214));

This allows the View-Source page to respect dark mode without needing a media query.

View-Source also uses a bunch of different text colors for syntax-highlighting, so I had to override those– to avoid picking my own colors, I borrowed the colors from the dark mode support in the Developer Tools.

Changelists and Bugs

There’s still more to do (e.g. text, json) but here’s a list of updates I’ve made so far:

Some of these changes are so simple you can even make them using Chromium’s web-based editor!

-Eric

Appendix: Other Dark Mode trivia

The edge://settings UI for themes is the correct way to set Dark Mode for the browser, and it will affect pages that are designed to respect Dark Mode using the prefers-color-scheme CSS media query. (Today, there’s unfortunately not a good way to select a dark browser UI theme without also changing the content area into dark mode, or vice versa. Some users have requested such a feature.)

A big limitation of Dark Mode when it comes to web content is that there are a great many pages that are not designed to support Dark Mode and as a consequence changing the browser to Dark Mode has no impact at all on the rendering of the website. That’s where the “Auto Dark Mode for Web Contents” feature flag on edge://flags comes into play. That experimental feature forces a site into Dark Mode, replacing its color scheme with one computed by the browser. This works well on some sites, but less well on others. A site can manually opt-out of the automatic mode, but few will.

MoarTLS: Non-Secure Download Blocking

With little fanfare, an important security change has arrived on the web. Now, all major browsers (except Safari) block non-secure downloads from a secure page.

Browser VersionBehavior
Edge 94+Block with right-click “Keep” button
Chrome 94Block Silently
Firefox 93Block with “Allow download” button
Brave 1.30.89Block Silently
Opera 79.0.4143.72Block Silently
Safari 15Allow
Vivaldi 4.3.2439.44Allow
Major Browser Behavior

Update: Starting in Edge 127, Edge will match Chrome in blocking downloads of most filetypes (with a few exceptions) from HTTP even when the page with the download link is also non-secure HTTP.

You can test your browser’s behavior with this test page. In Edge 94, the block looks like this:

By right-clicking on the “can’t be downloaded securely” item, you can choose to continue the download anyway.

Firefox offers a very similar user-experience, although somewhat confusingly, they prompt for permission to save the file before blocking it:

Firefox 93 Blocking UX

The Chromium team started rolling out this protection last year. Over time, the Chrome block turned into a silent block (arguably confusing for users) where the only indication of an attempted/blocked download is a notice in the Developer Tools console:

End-User Override

Within Chrome or Edge, a user may use the Permissions UI to enable a secure site to download non-secure resources without blocking.

IT Administrator Override

The InsecureContentAllowedForUrls policy allows an IT administrator to exempt sites from mixed content blocking. List the origins that are allowed to request non-secure content/downloads (list the source page’s origin, not the target resource’s origin):

InsecureContentallowedForUrls Policy

My MoarTLS browser extension makes it simple for you to see whether any of the links (including download links) on your page are non-secure:

… however, note that this tool only flags links that are directly non-secure– if the link goes to HTTPS but then subsequently redirects to (or through) HTTP, the tool won’t notice, but the browser blocker will.

The fact that the browser blocks the download if any URL used in a download’s source redirect chain is non-secure can lead to confusing UI whenever only a single URL is shown to the user. For instance, this download was blocked because the source page referred to HTTP but the request was subsequently redirected to the HTTPS URL shown:

The first step in avoiding mixed content download blocking is to ensure that all of your resources are available over HTTPS; if a download isn’t available over HTTPS, updating the source page’s download link’s url to point to https isn’t going to work.

The second step to avoiding blocking is to change all of the download links from HTTP to HTTPS.

Unfortunately, this might be much easier said than done– you might have hundreds of pages with hundreds of links.

What to do?

One approach is to use automation to rewrite links, either as a one-time job, or as a dynamic rewrite. When I was first building my test page above, I couldn’t figure out why it wasn’t working. It took a good 15 minutes to realize that I’d configured Cloudflare to automatically rewrite HTTP links to HTTPS. (In the Cloudflare Control panel, select SSL/TLS > Edge Certificates and enable Automatic HTTPS Rewrites.)

Content-Security-Policy offers an Upgrade-Insecure-Requests (UIR) directive that upgrades all of a page’s embedded resource URLs from HTTP to HTTPS. This is a great approach for fixing mixed content bugs without doing a lot of work on every page. Unfortunately, file downloads are typically treated as “Navigation requests”, which means that a UIR rule on https://example.com will upgrade http://example.com/dl/somefile but UIR will not upgrade https://othersite.example.com/dl/somefile because it is not same-origin to the original page. Bummer.

You might hope that just putting your download site on the Strict-Transport-Security (HSTS) pre-load list might fix things because doing so ensures that your site is always contacted over HTTPS. Unfortunately, for historical reasons, HSTS is evaluated after mixed content blocking and so this approach does not work. But the Chromium team is considering whether blocking should be bypassed if non-secure requests in the download flow were upgraded to HTTPS via HSTS or the browser’s “Always use HTTPS” setting such that every URL that actually hit the network was secure.

Browser Bugs

Today, if you try to close the browser without explicitly aborting the blocked download, Edge complains at you. I’ve filed feedback that we should just cancel.

HTTPS for all the things!

-Eric