Previously, I’ve described how to capture a network traffic log from Microsoft Edge, Google Chrome, and applications based on Chromium or Electron.
In this post, I aim to catalog some guidance for looking at these logs to help find the root cause of captured problems and otherwise make sense of the data collected.
Last Update: Jan 27, 2025 – I expect to update this post over time as I continue to gain experience in analyzing network logs.
Choose A Viewer – Fiddler or Catapult
After you’ve collected the net-export-log.json file using the about:net-export page in the browser, you’ll need to decide how to analyze it.
The NetLog file format consists of a JSON-encoded stream of event objects that are logged as interesting things happen in the network layer. At the start of the file there are dictionaries mapping integer IDs to symbolic constants, followed by event objects that make use of those IDs. As a consequence, it’s very rare that a human will be able to read anything interesting from a NetLog.json file using just a plaintext editor or even a JSON parser.
The most common (by far) approach to reading NetLogs is to use the Catapult NetLog Viewer, a HTML/JavaScript application which loads the JSON file and parses it into a much more readable set of events.
An alternative approach is to use the NetLog Importer for Telerik Fiddler.
Importing NetLogs to Fiddler
For Windows users who are familiar with Fiddler, the NetLog Importer extension for Fiddler is easy-to-use and it enables you to quickly visualize HTTP/HTTPS requests and responses. The steps are easy:
- Install the NetLog Importer,
- Open Fiddler, ideally in Viewer mode
fiddler.exe -viewer - Click File > Import > NetLog JSON
- Select the JSON file to import
In seconds, all of the HTTP/HTTPS traffic found in the capture will be presented for your review. If the log was compressed before it was sent to you, the importer will automatically extract the first JSON file from a chosen .ZIP or .GZ file, saving you a step.
In addition to the requests and responses parsed from the log, there are a number of pseudo-Sessions with a fake host of NETLOG that represent metadata extracted from the log:
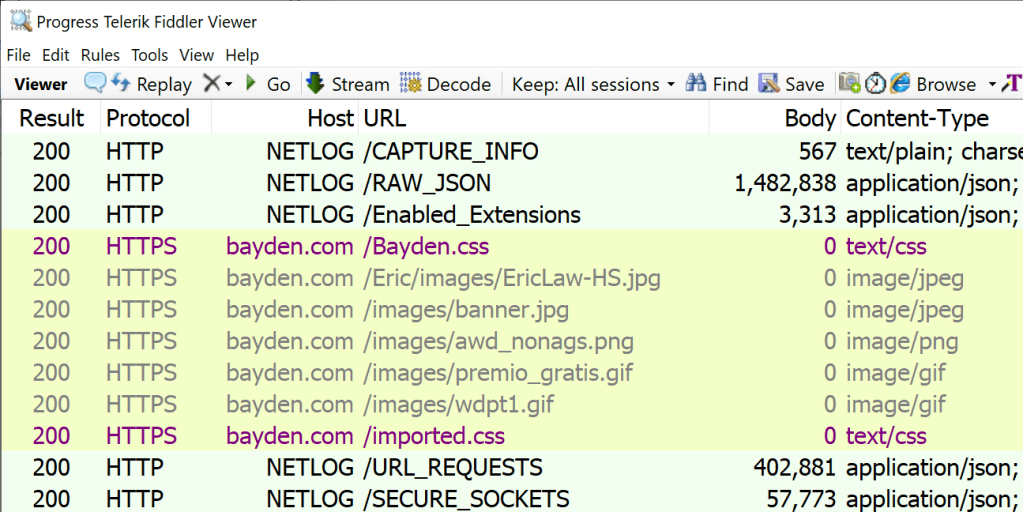
These pseudo-sessions include:
- RAW_JSON contains the raw constants and event data. You probably will never want to examine this view.
- CAPTURE_INFO contains basic data about the date/time of the capture, what browser and OS version were used, and the command line arguments to the browser.
- ENABLED_EXTENSIONS contains the list of extensions that are enabled in this browser instance. This entry will be missing if the log was captured using the –log-net-log command line argument.
- URL_REQUESTS contains a dictionary mapping every event related to URL_REQUEST back to the URL Requests to which it belongs. This provides a different view of the events that were used in the parsing of the Web Sessions added to the traffic list.
- SECURE_SOCKETS contains a list of all of the HTTPS sockets that were established for network requests, including the certificates sent by the server and the parameters requested of any client certificates. The Server certificates can be viewed by saving the contents of a –BEGIN CERTIFICATE– entry to a file named something.cer. Alternatively, select the line, hit CTRL+C, click Edit > Paste As Sessions, select the Certificates Inspector and press its Content Certificates button.
You can then use Fiddler’s UI to examine each of the Web Sessions.
Limitations
The NetLog format currently does not store request body bytes, so those will always be missing (e.g. on POST requests).
Unless the Include Raw Bytes option was selected by the user collecting the capture, all of the response bytes will be missing as well. Fiddler will show a “dropped” notice when the body bytes are missing:

If the user did not select the Include Cookies and Credentials option, any Cookie or Authorization headers will be stripped down to help protect private data:

Scenario: Finding URLs
You can use Fiddler’s full text search feature to look for URLs of interest if the traffic capture includes raw bytes. Otherwise, you can search the Request URLs and headers alone.
On any session, you can use Fiddler’s “P” keystroke (or the Select > Parent Request context menu command) to attempt to walk back to the request’s creator (e.g. referring HTML page).
You can look for the traffic_annotation value that reflects why a resource was requested by looking for the X-Netlog-Traffic_Annotation Session Flag.
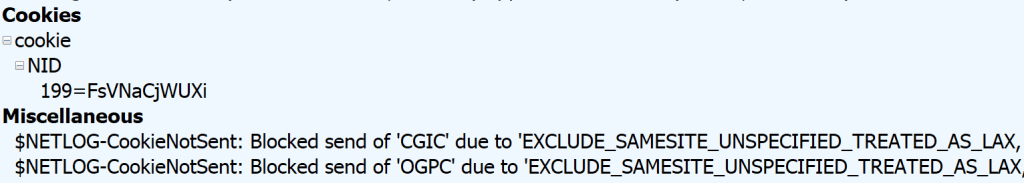
Scenario: Cookie Issues
If Fiddler sees that cookies were not set or sent due to features like SameSiteByDefault cookies, it will make a note of that in the Session using a psuedo $NETLOG-CookieNotSent or $NETLOG-CookieNotSet header on the request or response:
Closing Notes
If you’re interested in learning more about this extension, see announcement blog post and the open-source code.
While the Fiddler Importer is very convenient for analyzing many types of problems, for others, you need to go deeper and look at the raw events in the log using the Catapult Viewer.
Viewing NetLogs with the Catapult Viewer
Opening NetLogs with the Catapult NetLog Viewer is even simpler:
- Navigate to the web viewer
- Select the JSON file to view
If you find yourself opening NetLogs routinely, you might consider using a shortcut to launch the Viewer in an “App Mode” browser instance: msedge.exe --app=https://netlog-viewer.appspot.com/#import
The App Mode instance is a standalone window which doesn’t contain tabs or other UI:

Note that the Catapult Viewer is a standalone HTML application. If you like, you can save it as a .HTML file on your local computer and use it even when completely disconnected from the Internet. The only advantage to loading it from appspot.com is that the version hosted there is updated from time to time.
Along the left side of the window are tabs that offer different views of the data– most of the action takes place on the Events tab.
Start Here: The Chromium Project wrote a Crash Course for examining NetLog Events.
Tips
If the problem only exists on one browser instance, check the Command Line parameters and Active Field trials sections on the Import tab to see if there’s an experimental flag that may have caused the breakage. Similarly, check the Modules tab to see if there are any browser extensions that might explain the problem.
Entries with IDs below 0 (e.g. -214747…) are recorded by the browser process (e.g. CERT_VERIFIER_TASK); the other entries are recorded by the Network Process. By partitioning the ID space, the log avoids the problem of duplicated values without complex cross-process communication. The default sort order of the netlog viewer is the Start Time of the source.
Each URL Request has a traffic_annotation value which is a hash you can look up in a list generated from annotations.xml (which no longer directly contains the hash code). That annotation will help you find what part of Chromium generated the network request:

Most requests generated by web content will be generated by the blink_resource_loader, navigations will have navigation_url_loader and requests from features running in the browser process are likely to have other sources.
Scenario: Certificate Problems
If page loads are failing and showing errors like ERR_CERT_INVALID, a NetLog may provide additional information. Search for type:CERT_VERIFIER to see the events related to validating certificates. In particular, the CERT_VERIFIER_TASK will show errors when a certificate chain is built. For example, this entry notes that the certificate chain was deemed invalid because the Intermediate CA violated Name Constraints requirements specified in the root certificate:

Within a CERT_VERIFIER_JOB, you can see the hashes of the certificates that make up the trust chain that the browser built:
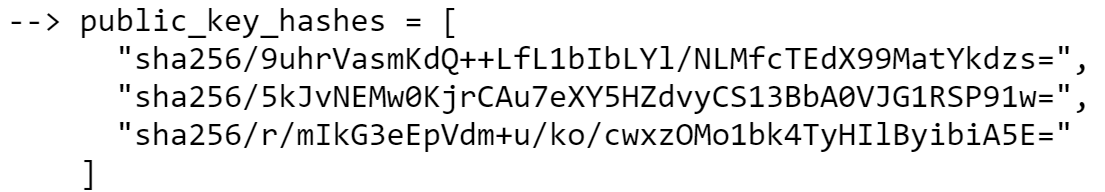
You can copy any of the sha256/... strings into the query box on https://crt.sh/ to look up information about that certificate.
Scenario: DNS Issues
Look at the DNS tab on the left, and HOST_RESOLVER_IMPL_JOB entries in the Events tab.
One interesting fact: The DNS Error page performs an asynchronous probe to see whether the configured DNS provider is working generally. The Error page also has automatic retry logic; you’ll see a duplicate URL_REQUEST sent shortly after the failed one, with the VALIDATE_CACHE load flag added to it. In this way, you might see a DNS_PROBE_FINISHED_NXDOMAIN error magically disappear if the user’s router’s DNS flakes.
You may see a UDP_SOCKET for the address fd3e:4f5a:5b81::1 and wonder why there is a connection to a server with the hostname dns.msftncsi.com. This is a red-herring; this UDP socket is meant to be used only to determine information about the local network configuration (to find out the default local address on a multi-homed endpoint). No packets should be sent for this socket. Upstream in Chrome/Chromium, Google uses an address it controls for the same purpose.
Scenario: Cookie Issues
Look for COOKIE_INCLUSION_STATUS events for details about each candidate cookie that was considered for sending (send) or setting (store) on a given URL Request. In particular, watch for cookies that were excluded due to SameSite or similar problems. Also check for cookies that failed to store (e.g. EXCLUDE_FAILURE_TO_STORE) because they failed to parse (e.g. the Set-Cookie string was longer than 4096 characters).
A corner case is if the cookie is received already expired (e.g. with an expires date in the past of the client’s time or the server’s Date header), in which case the store operation will be marked as expire:

Scenario: HTTPS Handshaking Issues
Look for SSL_CONNECT_JOB entries. Look at the raw TLS messages on the SOCKET entries. Read the HTTPS Certificate Issues section next.
Scenario: HTTPS Certificate Issues
Note: While NetLogs are great for capturing certs, you can also get the site’s certificate from the browser’s certificate error page.
When a HTTPS connection is established, the server sends one or more certificates representing the “end-entity” (web server) and (optionally) intermediate certificates that chain back to a trusted CA. The browser must use these certificates to try to build a “chain” back to a certificate “root” in the browser/OS trust store. This process of chain building is very complicated.
NetLogs include both the certificates explicitly sent by the server as well as the full chain of certificates it selected when building a chain back to the trusted root (if any).
The NetLog includes the certificates received for each HTTPS connection in the base64-encoded SSL_CERTIFICATES_RECEIVED events, and you can look at CERT_VERIFIER_JOB entries to see Chromium’s analysis of the trust chain. If you see ocsp_response entries, it means that the server stapled OCSP responses on the connection. is_issued_by_known_root indicates whether the chain terminates in a “public” PKI root (e.g. a public CA); if it’s false it means the trust root was a private CA installed on the PC. A verification result of Invalid means that the platform certificate verifier (on Windows, CAPI2) returned an error that didn’t map to one of the Chromium error statuses.
To view the certificates, just copy paste each certificate (including ---BEGIN to END---) out to a text file, name it log.cer, and use the OS certificate viewer to view it. Or you can copy the certificate blocks to your clipboard, and in Fiddler, click Edit > Paste As Sessions, select the Certificates Inspector and press its Content Certificates button.
If you’ve got Chromium’s repo, you can instead use the script at \src\net\tools\print_certificates.py to decode the certificates. There’s also a cert_verify_tool in the Chromium source you might build and try. For Mac, using verify-cert to check the cert and dump-trust-settings to check the state of the Root Trust Store might be useful.
In some cases, running the certificate through an analyzer like https://crt.sh/lintcert can flag relevant problems.
Scenario: Authentication Issues
Look for HTTP_AUTH_CONTROLLER events, and responses with the status codes 401, 403, and 407.
- If the
HTTP_AUTH_CONTROLLERdoes not showAUTH_HANDLER_INIT, it indicates that the handler did not initialize, for instance because the scheme was unknown or disabled.
- You can look at the parameters on the
AUTH_LIBRARY_ACQUIRE_CREDSevent to understand whether ambient credentials were tried, or whether an explicitusernameanddomainwere provided via the credential prompt. - If a
SSL_CONNECT_JOBorSOCKETevents’Descriptionfield starts withpm/, it means that the connection is in ‘privacy mode’ to be used for CORSno-credentialsrequests, as is used forlinkfetches that specify thecrossoriginattribute.
- You might find that the authentication fails with
ERR_INVALID_AUTH_CREDENTIALSunless you enable the browser’sDisableAuthNegotiateCnameLookuppolicy (Kerberos has long been very tricky). Similarly, theEnableAuthNegotiatePortpolicy concerns whether a (non-standard) target port is used in computing the Service Principal Namespnused in Kerberos tickets, some services are configured to require this although they probably shouldn’t be. - When you’re debugging whether a Kerberos authentication can be delegated, the log may be a bit misleading. The dictionary of attributes for the
AUTH_LIBRARY_INIT_SEC_CTXevent is written here, and the delegated/mutual indicates that the value at that time is eitherkByKdcPolicyorkUnconstrained.
At the endAUTH_LIBRARY_INIT_SEC_CTXthepfContextAttrout value from the InitializeSecurityContext call is recorded in the log here. Note that if thesecurity_statusvalue isSEC_I_CONTINUE_NEEDED(590610), the other attributes recorded may not be accurate; the docs for ISC’spfContextAttrnote:
Do not check for security-related attributes until the final function call returns successfully. Particular context attributes can change during negotiation with a remote peer.
Scenario: Debugging Proxy Configuration Issues
See Debugging the behavior of Proxy Configuration Scripts and Debugging Proxy Issues with NetLogs.
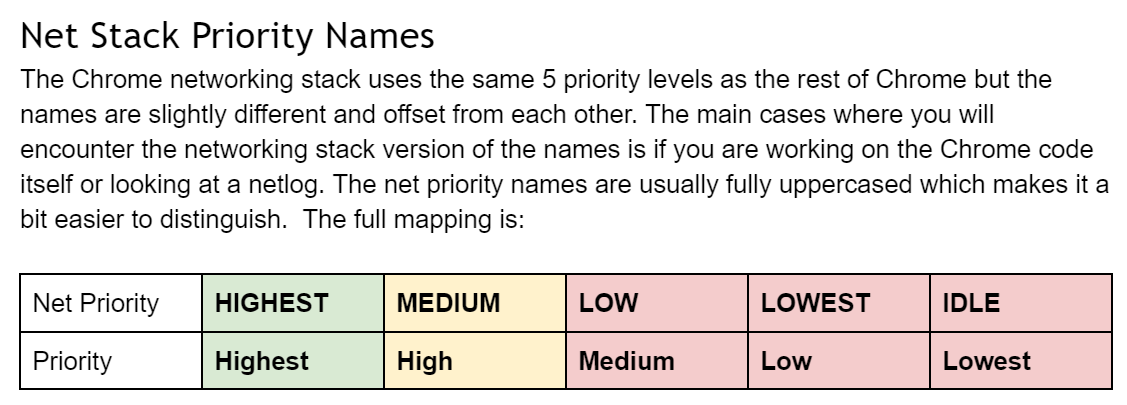
Scenario: Request Priorities
There are many different levels of prioritization of requests inside the web platform. The URL_REQUEST has a priority value that (confusingly) does not match the Priority column in the Developer Tools’ Net tab.
Got a great NetLog debugging tip I should include here? Please leave a comment and teach me!
-Eric
