Last time, we looked at how to troubleshoot browser crashes. However, not all browser problems result in the tab or browser crashing entirely. In some cases, the problem is that some part of the browser UI doesn’t render correctly.
This most commonly occurs with parts of the UI that are written in HTML and JavaScript. In Chromium-based browsers, that includes the F12 Developer Tools and the pages served from chrome:// or edge:// urls.
Within Microsoft Edge, HTML-based UI also includes many of the new UI elements including the History/Favorites/Download Manager “Hubs”/bubbles and the sidebar on the right.
Debugging Built-in Pages
Sometimes, a built-in page will fail to function or render correctly, or might not show any content at all. For example, performing a search inside edge://settings might result in the page content disappearing entirely.

When this happens, you can simply hit F12 to open the browser’s F12 Developer Tools. The Console tab of the tools will show the JavaScript error that caused the problem. If you report the bug (Alt+Shift+I), including the Console tab’s content in your screenshot will make it simpler for the engineers to figure out what went wrong.
Debugging Developer Tools
Sometimes, one or more tabs in the F12 Developer Tools does not load as expected. For example, here’s a case where the Application tab doesn’t load:

Fortunately, you can use a second instance of the Developer Tools to debug the Developer Tools!
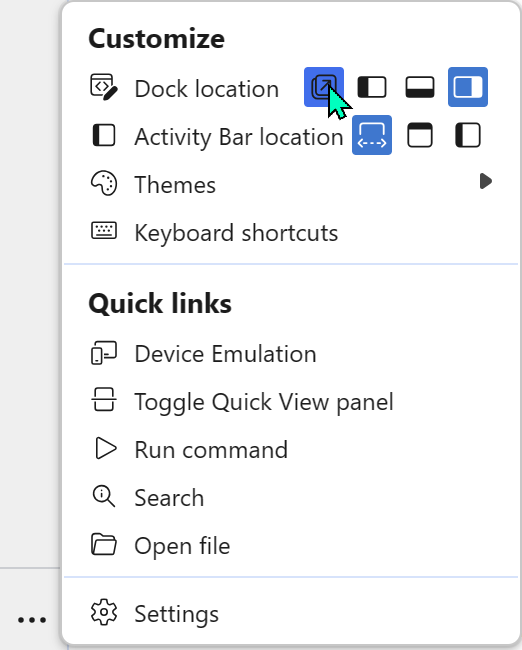
First, undock the DevTools into their own window by clicking the … menu inside the tools, then set the Dock location to undocked.
Next, use the Developer Tools to debug the Developer Tools by clicking into the DevTools window and hitting the Ctrl+Shift+I keyboard shortcut. A second instance of the DevTools will appear, debugging the first instance of the DevTools:

The Console tab of the second Developer Tools instance will show any script errors from the first:

Debugging Hubs
Within Edge, various flyouts from the toolbar are implemented as small HTML content areas that appear when you click various toolbar buttons. To debug these flyouts:
- Open a second Edge window and navigate it to
edge://inspect. - Click the Pages link on the left-hand side.
- In the first window, open the problematic Hub UI (e.g. hit
Ctrl+Hto open the History hub). - Click the
Inspectlink under the page that appears in the Pages list:

Alternatively, you could try loading the Hub as a top-level page by using its undocumented URL (e.g. navigate to edge://downloads/hub to open the Edge Downloads page in its Hubs mode).
Using DevTools to debug the browser itself feels like a super-power.
-Eric
