As a part of every page load, browsers have to make dozens, hundreds, or even thousands of decisions of varying levels of importance: should a particular API be available? Should a resource load be permitted? Should script be allowed to run? Should video be allowed to start playing automatically? Should cookies or credentials be sent on network requests? The list is long.
In Chromium, most of these decisions are controlled by per-site settings that must be manually1 configured by either the user, or administrative policy.
However, manual configuration of settings is tedious, and, for some low-impact decisions, probably not worth the effort.
Wouldn’t it be cool if each user’s individual browser were smart enough to consider clues about what behavior that specific user is likely to want, and then use those clues in picking a default behavior?
User Activation / Gestures
The first, and simplest, mechanism used to make smarter decision is called user-gestures. Certain Web APIs and browser features (e.g. the popup blocker, file download experience, full-screen API, etc) require that the user has interacted with the page before the feature can be used.
This unblocking signal is called a User Gesture or (formally) User Activation.
Requiring a User Gesture can help prevent (or throttle) simple and unwanted “drive by” behaviors, where a website uses (abuses?) a powerful API without any indication that a user wants to allow a site to use it.
Unfortunately, User Gestures are a pretty low hurdle against abuse– sites can perform a variety of trickery to induce the user to click and unlock the protected feature.
Enter Site Engagement
Chromium supports a feature called Site Engagement, which works similarly to User Activation, but stretched over time. Instead of allowing a single gesture to unblock a single API call that occurs within the subsequent 5 seconds, Site Engagement calculates a score that grows with user interactions and decays over inactive time. In this way, sites that you visit often and engage with heavily offer a streamlined experience vs. a site you’ve only visited once (e.g. while you’re clicking around in search results). If you stop engaging with a site for a while, its engagement score decays and it loses any “credit” it had accrued.
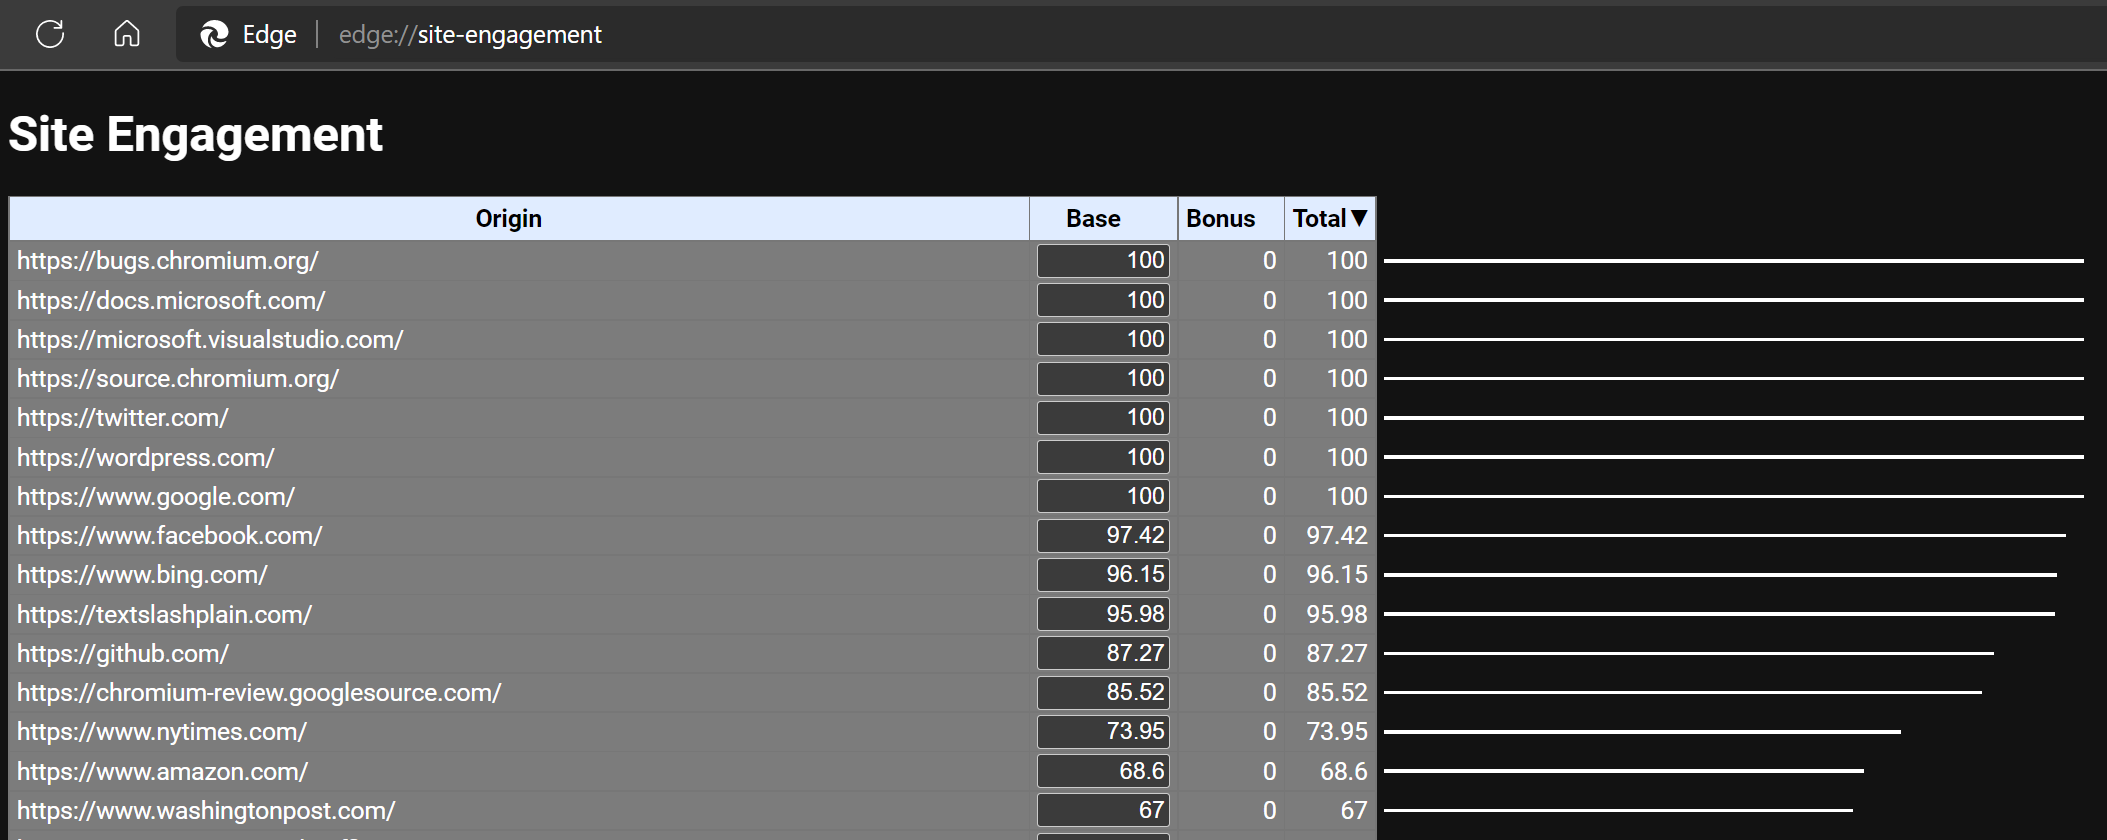
You can easily see your browser’s unique Engagement scores by visiting the url: about://site-engagement/. Here’s what mine looks like:
If you like, you can use the textboxes next to each site to manually adjust its score (e.g. for debugging).
A separate page, about://media-engagement/ tracks your engagement with Media content (e.g. video players).
The Site Engagement primitive can be used in many different features; for instance, it can weigh into things like:
May Audio/video automatically start playback without a user-gesture?
Should a permission prompt be presented as a balloon, or a more subtle icon in the toolbar?
Should an “International Domain Name” be displayed in (potentially misleading) Unicode, or should it show in Punycode?
Site Engagement is a more robust mechanism than User Activation, but it’s still just a heuristic that can suffer from both false negatives (e.g. I’m using InPrivate or have just cleared my history, and am now visiting a trusted site) and false positives (a site has tricked me into engaging over time and now starts abusive behavior). As such, each feature’s respect for Site Engagement must be carefully considered, and recovery from false-negatives and false-positives must be simple.
Bespoke Mechanisms
Beyond User Activation and User Gesture requirements, various other signals have been proposed or used as clues into what behavior the user wants.
In determining whether a given file download is likely to be desired, for instance, the Downloads code uses a Familiar Initiator heuristic, which treats downloads as less suspicious if the originator of the Download request is a site that the user has visited before the current date.
Other features have considered such signals as:
Is the site one that the user visited by navigating via the address bar (as opposed to navigations triggered by script)
Is the site’s origin amongst the user’s Bookmarks/Favorites?
Is the site an installed PWA?
Do otherusers of a given site often respond to a particular permission decision in a particular way (aka “Cloud Consent”)? This approach is used in Adaptive Notifications.
Impact on Debugging
One downside of all of these mechanisms is that they can make debugging harder for folks like me– what you saw on your browser might not be what I see on mine, and what you experienced yesterday might not be what you experience tomorrow.
Tools like the about:site-engagement page can allow me to mimic some of your configuration, but some settings (e.g. the Familiar Initiator heuristic, or the timing of your User Gestures) are harder to account for.
That said, while smarter browsers are somewhat harder to debug, they can be much more friendly for end-users.
-Eric
PS: Browser designers must carefully consider how Site Engagement may result in web-visible side-effects. For example, can another site infer whether a given user is a frequent visitor to a site based on how the browser behaves?
Back in January, I wrote about my New Years’ Resolutions. I’m now 45 days in, and things are going pretty well.
Health and Finance: A dry January. Dry January has turned into dry February. Beyond idle thoughts “What should I do right now? In the old days, I’d pour myself a drink” and ten tough seconds (someone opened a delicious-smelling bottle of wine), I haven’t missed alcohol at all.
Health: Track my weight and other metrics.Done. I’m weighing in on my smart scale twice a week. I have a blood pressure cuff now; I haven’t been using it very regularly though. All metrics are headed in the right direction.
Health: Find sustainable fitness habits.Going great. I’ve bought a fancy treadmill and started using it, along with the exercise bike I bought in August 2020 and haven’t used until now. I’m working out at least 5 days a week for an hour or more.I also signed up for the Austin Capitol 10K in April, although I expect to walk a lot of it.
Travel: Haven’t yet booked an Alaska cruise, but it’s still on the back burner. I did book a near-repeat of the Christmas cruise for me and the kids over Spring break, and I’ve made some progress on bigger travel plans.
Finance: Spend more intentionally. Between the treadmill and the cruise, I’ve spent a lot of money so far in 2022, but for the most part it doesn’t feel wasted. The stock market hasn’t been doing too well, so I’m not feeling super-duper secure here.
Life: Produce more. I haven’t done a ton of this, beyond blogging and working on tools. I’m trying Hello Fresh, which has been educational and interesting– I’ve not really cooked anything remotely fancy before. I’ve also made some progress on delayed and on-going house projects though.
Sadly, work has not been going great, but everything else in life seems to be considerably better than a few months ago.
The MHTML file format (aka “Webpage, single file”) allows a single file to contain the multiple resources that are used to load a webpage (script, css, images, etc).
Edge (Chromium) has an option to use the format when saving the current page via Ctrl+S or the Save page as... menu command:
Saving MHTML from Save Page As…
… but the browser’s code has limited support for the MHTML format, meaning that it often cannot render files that it itself did not create, and even when loading files that it did create, there are several intentional restrictions.
Restriction: No Script
Reloading a saved MHTML file in Edge/Chrome/Chromium/etc will disable script.
Interestingly, when Chromium saves an MHTML file, it omits the <script> and <noscript> blocks entirely. If you saved the MHTML file from another tool that included script, when reloaded in Chromium, its script is not executed and a notice is shown in the Developer Tools Console:
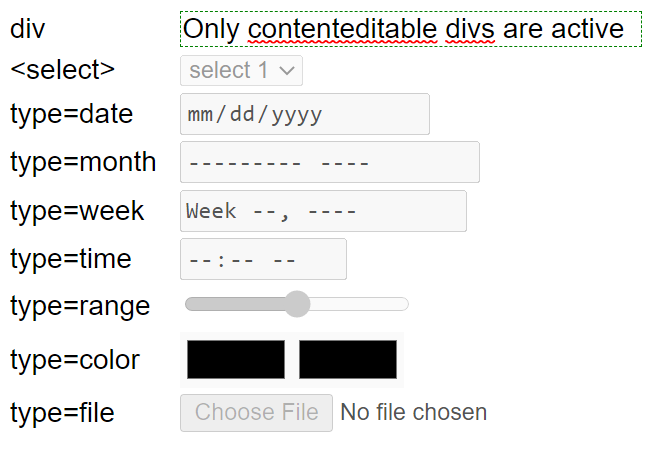
Restriction: Disabled Forms
When loading a MHTML file, form controls like text fields and buttons are disabled, preventing the user from filling or submitting a form:
Restriction: Resources May not load
Chromium uses very restrictive rules for Same-Origin-Policy evaluation that can often prevent embedded resources (including images and stylesheets from loading) properly, leading to missing content and console warnings:
Limitation: Encodings
Internet Explorer’s MHTML component supported a variety of content-encodings that are not supported in Chromium. I fixed one bug but there are numerous other limitations in MHTML support.
Workaround: IEMode
If you need to load legacy MHTML content to load in Edge, your best bet is to configure the file to load in IEMode.
Edge includes some code which attempts to automatically detect whether a given MHTML file is compatible with Edge mode, e.g. checking for a Saved by Blink marker:
UPDATE: Note that opening MHT files in Internet Explorer represents a large attack surface, because it means that a bad actor could send a victim a malicious MHT file that exploits a 0-day in Internet Explorer.
If the victim opens the downloaded MHT and it switches to load in IE Mode automatically, the attacker could possibly escape the weaker IE sandbox and cause havoc. As of Edge 118, a downloaded MHT file (identified by a Zone.Identifier alternate data stream, aka mark of the web) will not open in IE Mode automatically unless a new group policy is enabled to accept the security risk.
Previously, I’ve writtena lot about Application Protocols, which are a simple and popular common mechanism for browsers to send a short string of data out to an external application for handling. For instance, mailto is a common example of a scheme treated as an Application Protocol; if you invoke mailto:someone@somewhere.com, the browser will convert this to an OS execution of e.g.:
outlook.exe mailto:someone@somewhere.com
Application Protocols are popular because they are simple, work across most browsers on most operating systems, and because they can be added by 3rd parties without changes to the browser.
However, Application Protocols have one crucial shortcoming– they cannot directly return any data to the browser itself. If you wanted to do something like:
<img src='myScheme://photos/mypic.png' />
… there’s no straightforward way for your application protocol to send data back into the browser to render in that image tag.
You might be thinking: “Why can’t I, a third-party, simply provide a full implementation of a protocol scheme, such that my object gets a URL, and it returns a stream of bytes representing the data from that URL, just like HTTP and HTTPS do?“
Asynchronous Pluggable Protocols
Back in the early days of Internet Explorer (1990s), the team didn’t know what protocols would turn out to be important. So, they built a richly extensible system of “Asynchronous Pluggable Protocols” (APP) which allowed COM objects to supply a full implementation of a protocol. The browser, upon seeing a URL (“moniker”) would parse the URL Scheme out, then “bind” to the APP object and send/receive data from that object. This allowed Internet Explorer to handle URLs in an abstract way and support a broad range of protocols (e.g. ftp, file, gopher, http, https, about, mailto, etc).
In many cases, we think only about receiving data from a protocol, but it’s important to remember that you can also send data (beyond the url) to a protocol; consider a file upload form that uses the POST method to send a form over HTTPS, for example.
Writing an APP was extremely challenging, and very risky– because APPs are exposed to the web, a buggy APP could be exploited by any webpage, and thanks to the lack of sandboxing in early IE, would usually result in full Remote Code Execution and compromise of the system. Beyond the security concerns, there were reliability challenges as well– writing code that would properly handle the complex threading model of a browser downloading content for a web page was very difficult, and many APP implementations would crash or hang the browser when conditions weren’t as the developer expected.
Despite the complexity and risk, writing APPs provided Internet Explorer with unprecedented extensibility power. “Back in the day” I was able to do some fun things, like add support for data: URLs to IE7 before the browser itself got around to supporting such URLs.
Understanding Custom Schemes
Sending a URL to into an APP object and getting bytes back from a stream is only half of the implementation challenge, however.
The other half is figuring out how the rest of the browser and web platform should handle these URLs. For Internet Explorer, we had a mechanism that allowed the host (browser) to query the protocol about how its URLs should be handled. The IInternetProtocolInfo interface allowed the APP’s code to handle the comparison and combination of URLs using its scheme, and allowed the code to answer questions about how web content returned from the URL should behave.
For instance, to fully support a scheme, the browser needs to be able to answer questions like:
Is this scheme “standard” (allowing default canonicalization behaviors like removing \..\ sequences), or “opaque” (in which other components cannot safely touch the URL)?
Is this scheme “Secure” (Allow in HTTPS pages without mixed content warnings, allow WebAPIs that require a secure context, etc)
Does this scheme participate in CORS?
Does this scheme get sent as a referrer?
Is this scheme allowed from Sandboxed frames?
Can top-level frames be navigated to this scheme?
Can such navigations only occur from trusted contexts (app/omnibox) or is JavaScript allowed to invoke such navigations?
How do navigations to these urls interact with all of the other WebNavigation/WebRequest extensibility APIs?
How does the scheme interact with the sandbox? What process isolation is used?
What origin is returned to web content running from the scheme?
How does content from the scheme interact with the cookie store?
How does it interact with CSP?
How does it interact with WebStorage?
Implementing Protocols in Chromium
Unlike Internet Explorer, Chromium does not offer a mechanism for third-party extensibility of its protocols; the browser itself must have support for a new protocol compiled in. A subclassed URLLoaderFactory (e.g. about, blob) invokes the correct url_loader implementation that returns the data for the response.
Chromium doesn’t have an analogue for the IInternetProtocolInfo interface for protocol implementors to implement; instead, the scheme must be manually added to each of the per-behavior lists of schemes hardcoded into Chromium.
Brave documented some of the work they needed to do to add a protocol to their Chromium-based browser.
By moving from our old codebase to Chromium, the Microsoft Edge team significantly modernized our codebase and improved our compatibility with websites. As we now share the vast majority of our web platform code with the market-leading browser, it’s rare to find websites that behave differently in Edge when compared to Chrome, Brave, Opera, Vivaldi, etc. Any time we find a behavioral delta, we are keen to dive in and understand why Edge behaves differently. Sometimes, our investigation will reveal a behavior gap caused by a known and deliberate difference (e.g. we add an Edg/ token to our User-Agent string), but in the most interesting cases, something unexpected is found.
Yesterday, I came across an interesting case. In this post, I’ll share both how I approached root causing the difference, and explore how it can be avoided.
The Customer’s Issue
The Microsoft Edge team works hard to ensure that Enterprises can move fearlessly to Edge, both from legacy IE/Spartan, and from other browsers.
One such Enterprise recently contacted us to report that one of their workflows did not work as expected in Edge 96, noting that the flow in question works fine in both Google Chrome and Apple Safari.
Common causes (e.g. a different User-Agent header, Tracking Prevention set to defaults) were quickly ruled out as root causes: you can easily run Edge with a different User-Agent header (via the --user-agentcommand line argument or via the Emulation feature in the F12 Developer Tools) and Tracking Prevention reports any blocked storage or network requests to the F12 Console.
The customer’s engineers noted that the problem seemed to be that Edge was failing to send a cross-origin fetch request– NetLogs of the flow revealed that the fetch request began, but never completed. As a result of failing to send the request, a WebAPI was not invoked, and the user was unable to change the state of the web application.
This was a super-interesting finding because Edge shares essentially all of its code in this area with upstream Chromium.
The customer shared their NetLogs with us, and I took a shot at analyzing the traffic captured within. Unfortunately, the results were inconclusive: it was easy to see that the request had indeed not been sent, but it was not clear why.
Here’s a snippet of the log for the attempt to call the API. We see that the request was a POST to an invokeAPI page on a different server, and because of the request’s Content-Type (application/json) the browser was required to perform a CORS preflight request before sending the POST to the remote server.
Crucially, we see that at 9293 milliseconds (175ms after the request process began), the request was aborted (-CORS_REQUEST). Not until 118 milliseconds later did the response to the preflight (CORS_PREFLIGHT_RESULT) come back saying, in effect, “Sure, I’m okay with accepting a request with that Content-Type and the POST method.” But it was too late– the request was already cancelled. The question is: “Why did the request get cancelled?”
A quick look at the webapp’s JavaScript didn’t show any explicit code that would cancel the fetch(). My hunch was that the request got cancelled because the fetch() call was in a frame that got navigated elsewhere before the request completed, but in this complicated application, network requests were constantly firing. That made it very difficult to prove or disprove my theory from looking at the Network Traffic alone. I tried looking at an edge://tracing log supplied by the customer, but the application was so complicated that I couldn’t make any sense of it.
And the larger question loomed: Even if teardown due to navigation is the culprit, why doesn’t this repro in Chrome?
The overall workflow involves several servers, including a SharePoint site, Microsoft Outlook Online, and custom logic running on Microsoft Azure. There didn’t seem to be any good way for us to emulate this workflow, but fortunately, the customer was willing to provide us with credentials to their test environment.
I started by confirming the repro in both Edge Stable and Canary, and confirming that the problem did not repro in either Chrome Stable or Canary. As this web application used a ServiceWorker, I also confirmed that unregistering the worker (using the Application tab of the F12 DevTools) did not impact the repro.
With this confirmation in hand, I then aimed to test my hunch that navigation was the root cause of the WebAPI fetch request not being sent.
A New Debugging Tool
One significant limitation of NetLogs is that, while the URL_REQUEST entries in the log have tons of information about the content and network behavior of the request, the NetLogs don’t have much context about why a given request was made, or where its result will be used by the web application.
Fortunately, Chromium’s rich extensibility model surfaces events for both Navigations and Network Requests, including (crucially) information about which browser tab and frame generated the event.
As a part of my recent NativeMessaging Debugger project, I built a simple sample extension which watches for navigations and sends information out to a log window. For this exercise, I updated it to also watch for WebRequests. With this new logging in place, I reproduced the scenario, and it was plain that the fetch() call to the WebAPI was being cancelled due to navigation:
The first event shows a top-level navigation (tabId:60, frameId:0) begin to MyTasks.aspx, although the navigation’s request hasn’t hit the network yet.
Then, six milliseconds later, we see the WebAPI’s fetch() call begin.
Six milliseconds after that, we see the network request for the navigation get underway, effectively racing against the outstanding WebAPI call.
From our NetLog, we know the navigation wins– the WebAPI’s fetch() preflight alone took 293ms to return, and the overall fetch request was aborted after just 175ms, right after the navigation’s request got back a set of HTTP/200 response headers.
So, my hunch is confirmed: The API call was aborted because the script context in which it was requested got torn down.
I was feeling pretty smug about my psychic debugging success but for one niggling thought: Why was this only happening in Edge?
Maybe this is happening because Chrome has some experiment running that changes the behavior of CORS or the JavaScript scheduler? I checked chrome://version/?show-variations-cmd and searched for any likely experiment names. Nothing seemed very promising, although I tried using the --enable-features command line argument to turn on a few flags in Edge to see if they mattered. No dice — Edge still repro’d the issue. I tried performing the repro in my local version of Chromium, which doesn’t run with any server-controlled flags. No dice — Chromium didn’t repro the issue. I even tried running a bisect against Chromium to see if any older Chromium build has this problem. Nope, going all the way back to Chrome 60, the workflow ran just fine.
I wanted to try bisecting against Edge, but unfortunately this isn’t simple to do without being set up with an Edge development environment (I develop directly against upstream Chromium). However, I did have a standalone copy of Edge 91 handy, and the problem repro’d there as well, so at least this wasn’t a super-recent regression.
I don’t like unsolved mysteries, but by this point I at least knew how the customer could fix this on their side. Their code for submitting the form looked like this:
  t.prototype.Submit = function() {
   this.callAPI(this.email, t),
   alert("Success"),
   setTimeout(function() {console.log("Wait 1sec")},1000),
   location.href = n + "/MyTasks.aspx")
 };

 t.prototype.callAPI = function(e, t) {
  var n = JSON.stringify({data: e}), o = new Headers;
  o.append("Content-type", "application/json");
  var i = {body: n,headers: o};
  this.post("https://logic.azure.com/invokeAPI",i).then(function(e)
         {return console.log("API call complete"), e.json()})
 };
As you can see, the Submit() function calls the callAPI() function to send the POST request, then shows an alert saying “Success”. Script execution pauses while the alert dialog is showing. When the user clicks “OK” in the alert(), a setTimeout call queues a callback with a one second delay, then navigates the top-level page to MyTasks.aspx.
This looks like a mistake– the location.href= call was probably meant to be inside the setTimeout callback; otherwise, that callback probably will never run because the page will have been torn down by the navigation before the callback’s console.log statement runs.
But more broadly, this code seems fundamentally wrong: We’re telling the user that the operation yielded “Success”, but we never actually waited for the WebAPI call to succeed— we just fired it off and then immediately showed the “Success” popup. The alert() and location.href='...' lines should probably be inside the then block on the .post call, and there should probably be error handling code for the case where that post call returned an error for any reason.
I wrote up this suggestion and sent it off to the customer– this should resolve their issue in Edge, and it’s more logical and correct in every browser.
…And yet… why is Edge different?
I went back to look at the event logs from my repro again. And I noticed something crucial: in Chrome, the wrBeforeRequest event signaling the start of the WebAPI call appeared before the alert dialog box, and the wrResponseHeaders event appeared while the alert box was up (3 seconds later). Only after I clicked OK on the dialog box (32 seconds after that) did the navigation event occur:
In contrast, in Edge, the alert dialog box appears before the wrBeforeRequest event– in fact, the wrBeforeRequest event isn’t even seen until after clicking OK to dismiss the dialog. At that point, the WebAPI and Navigation requests race, and the WebAPI request will almost always lose the race.
Ah ha! So we’re getting closer. Edge is failing because its fetch call is getting blocked until dismissal of the modal alert. That’s weird. Maybe it’s something about this site’s JavaScript? I tried creating a minimal repro where a fetch() would get kicked off asynchronously and then an alert() would immediately follow. In Chrome, the fetch ran as expected, while in Edge, the fetch blocked on the user clicking OK.
Now we’re cooking with gas. A working minimal repro dramatically increases the odds of solving any mystery, because it makes testing theories much simpler, and roping in other engineers much cheaper– instead of asking them to perform complicated repro steps that may take tens of minutes, you can say “Click this link. Push the button. See the bug. Weird, right?“
There’s been quite a lot of recent discussion about the Chrome team’s concerns about the 3 Web Platform modal dialog primitives (alert(), prompt(), and confirm()) and how they interact with the JavaScript event loop. Furious webdevs complain “If it ain’t broke, don’t fix it” and the web platform folks retort: “Oh, it’s very much broke, and we need to fix it!”.
Perhaps there’s some related change upstream is experimenting with? I spent another fruitless hour looking into their experimental configuration and ours, and bothering Edge’s alert() owners to find out if perhaps we might have changed anything about our alert() implementation for accessibility reasons or the like. No dice.
I wrote up my latest findings and sent them off to my engineers. With a reduced repro in hand, our Dev Manager popped up the edge://tracing tool and had a look around. He replied back: I suspect it has something to do with an Edge-specific throttle. Specifically, I see a WebURLLoader::Context::Start hitting a mojom.SafeBrowsingUrlChecker call that I don’t see in Chrome.
For context: Chromium supports the notion of throttles which allow a developer to react to events as the user browses around. For instance, throttles for resource loaders allow you to block and modify requests, which browser developers use to perform reputation scans for SafeBrowsing or SmartScreen, for example. NavigationThrottles allow developers to redirect or cancel navigations, and so on.
Way back in December 2019, one of our engineers noted that a test case behaved differently in Edge vs. Chrome. That test case was a page with three XHRs: two asynchronous and one synchronous. In Chrome, the two async calls ran in parallel with the sync call, while in Edge, the two async calls were blocked upon completion of the one sync call. The root cause was related to the Tracking Prevention throttle needing to perform a cross-process communication to check whether the XHRs’ url targets were potentially tracking servers. Even though synchronous XHRs are evil and need to die, we still fixed the testcase by updating the throttle so that it doesn’t run on same-origin requests (because they cannot be, by definition, 3rd party trackers).
In this week’s repro, the fetch call is async, but alert() is not– it’s a synchronous API that blocks JavaScript. And the WebAPI is to a 3rd-party URL, so the 2019 fix doesn’t prevent the throttle from running.
One interesting finding during the 2019 investigation was that turning off Tracking Prevention in edge://settings does not actually disable the throttle– it simply changes the throttle to not block any requests. With this recollection, I used the command line argument to disable the throttle entirely: msedge.exe --disable-features=msEnhancedTrackingPreventionEnabled
…and confirmed that the minimal test page now behaves identically in Edge vs. Chrome.
We’ve filed a bug against the throttle to figure out how to address this case, but the recommendation to the customer stands: the current logic popping the alert() box ought to change such that either there’s no alert(), or it only shows success after the fetch() call actually succeeds.