Starting in Microsoft Edge 77 (and Chrome 77), the prompt shown when launching an AppProtocol from the browser was changed to remove the “Always allow” checkbox. That change was made, in large part, because this prompt is the only thing standing between every arbitrary site on the Internet (loaded inside your browser’s sandbox) and a full-trust application on your computer (running outside of the browser’s sandbox). See the blog post for more details on why AppProtocols are so scary.
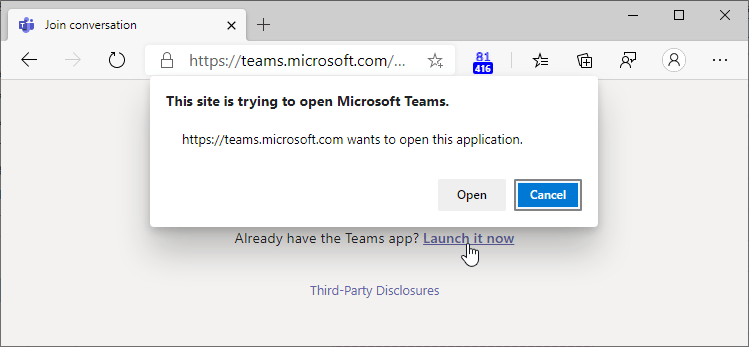
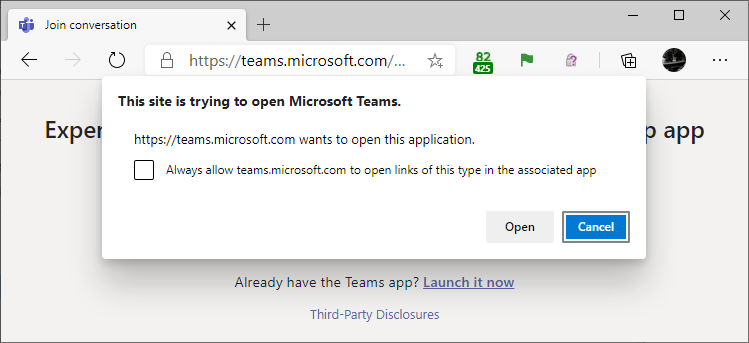
After Edge 77, when you try to launch a Microsoft Teams meeting, for instance, you’ll see a UI like this:
Unfortunately, there’s a downside to this security improvement.
The same prompt that protects users from malicious content on https://BadGuy.example also shows every single time the legitimate Microsoft Teams website tries to open its related application. Users complain that the security prompt feels redundant, and IT departments have howled that they’ll have to retrain users and field helpdesk calls.
In Edge 82.0.425.0 Canary, a new flag was added:
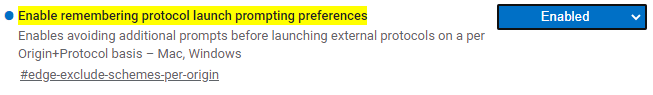
…and in Edge 84 it was enabled by default.
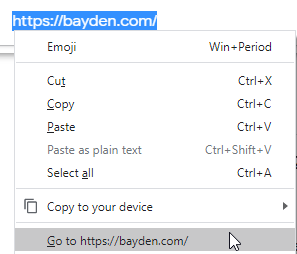
The prompt now includes a new checkbox: “Always allow <hostname> to open links of this type in the associated app”:
By storing exemptions on a per-site, per-scheme basis, attack surface is significantly reduced, because only sites you’ve specifically allowed in the past are permitted to bypass the prompt.
This change is also available in other browsers based on Chromium 84+.
Some notes on this change:
- Exemptions are stored on a per-scheme, per-origin basis (e.g. “Allow teams: from https://teams.microsoft.com“, so if multiple origins use the same scheme, you’ll need to exempt each one.
- Stored exemptions are origin specific:
https://site.exampleand https://www.site.example and http://site.exampleare all different origins. - Stored exemptions are only available for secure origins (basically: HTTPS, HTTP-to-Localhost, and FILE).
- This checkbox can be disabled using Group Policy.
- This checkbox does not appear if there’s no “Context URL” (e.g. the user pasted the protocol URL directly into the address bar without clicking a link).
- Starting in Edge 85, the new AutoLaunchProtocolsFromOrigins Group Policy allows an admin to preapprove exemption pairs (including non-secure origins) on behalf of their users. The policy allows admins to specify, for each protocol scheme, a list of sites (potentially including wildcards) that should be allowed to invoke the scheme without a prompt. The scheme itself cannot be wildcarded–there is no way to specify that a given site may invoke every protocol. Bug: As of Edge 109 and earlier, a * wildcard rule does not work if there’s no context URL (e.g. the user pasted the protocol URL directly into the address bar)[1].
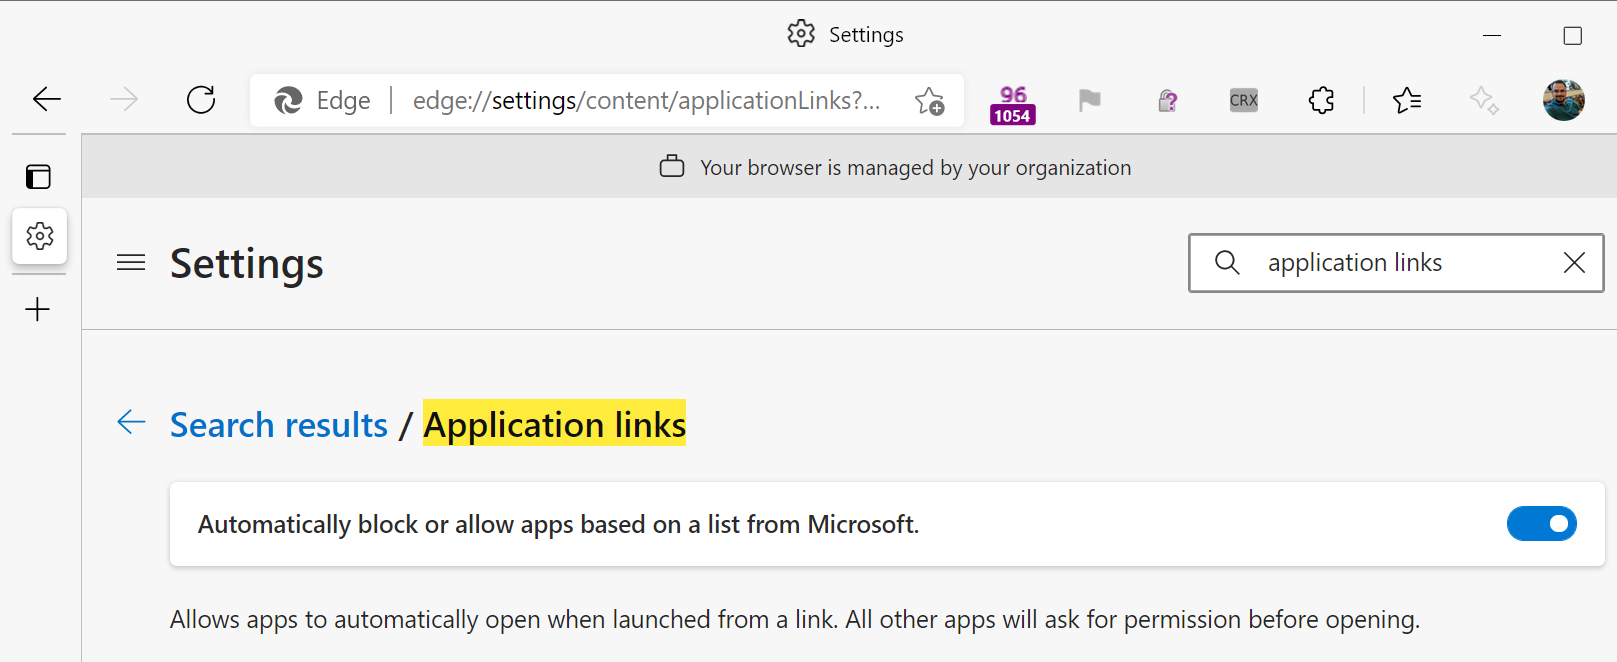
- In Edge 86 and later, you can see user-granted and Group Policy pushed exemptions by navigating to
edge://settings/content/applicationLinksin the browser. You can also remove user-granted exemptions in this page. - To clear all user-granted exemptions (in any version), you may use the “Cookies and other site data” checkbox in the Clear Browsing Data dialog box. Note that you can set the time range to anything you like– all Origin+Scheme exemptions will be cleared.
You can experiment with this feature using the AppProtocol test page.
Update: Microsoft Edge 96 introduces a new feature whereby Microsoft delivers an Edge AutoLaunch Protocols Component containing lists of scheme-origin dictionaries to automatically allow or block. This allows us to protect customers from dangerous schemes (e.g. a protocol handler with a 0-day) while reducing the annoyance of a prompt from known-safe pairings (e.g. the Teams website can open the Teams client app).
If for some reason you don’t want Microsoft Edge to block vulnerable protocol handlers and allow known-safe pairings, use the toggle inside edge://settings/content/applicationLinks, or set the policy AutoLaunchProtocolsComponentEnabled to false.
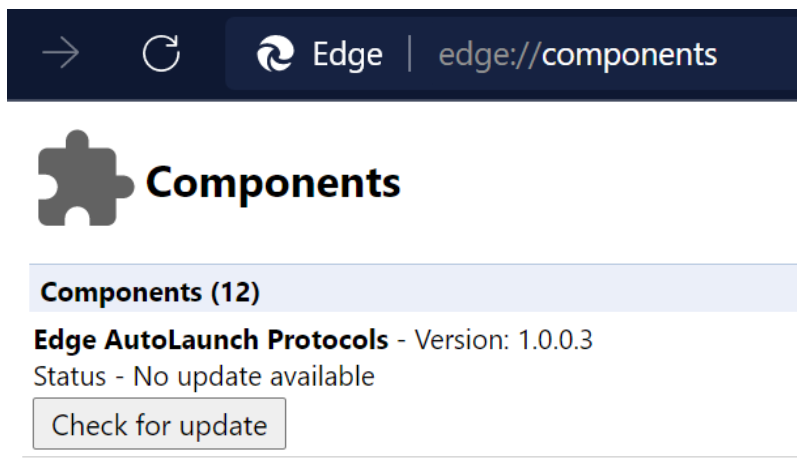
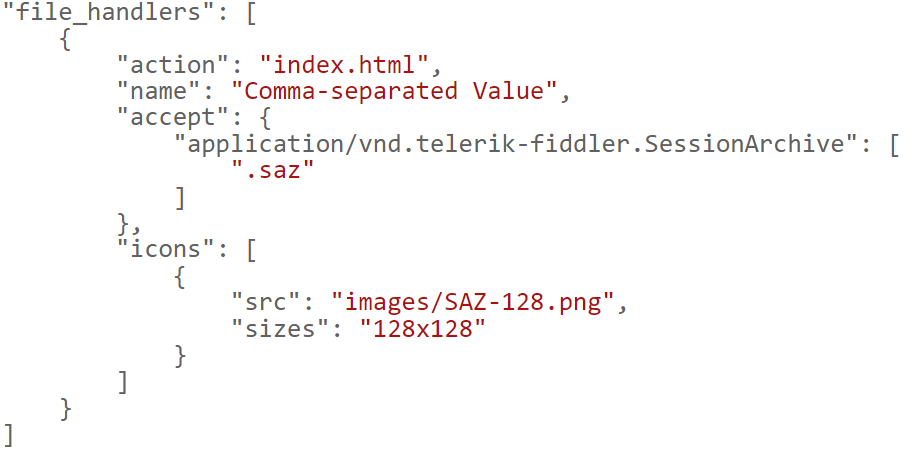
There’s no built-in viewer for the component, but all Components are basically just files in the profile. %userprofile%\AppData\local\microsoft\edge beta\user data\AutoLaunchProtocolsComponent\ contains a simple JSON file with the current rules.
Security Warning – “This thing’s loaded”
Keep in mind that any “bypass the Prompt for <X>” decision you’ve stored means that a vulnerability (e.g. an XSS or content-injection) on the target site could be used by an attacker to bypass the security prompt and launch the Application Protocol in a way not intended by the site you had granted permission.
-Eric
[1] Bug: The prompt, sans checkbox, is shown when there’s no context URL, even when a wildcard rule of * is specified.