Fall 2023 Races

While I’ve been running less, I haven’t completely fallen out of the habit, and I still find spending an hour on the treadmill to be the simplest way to feel better for the rest of the day. Real-world racing remains appealing, for the excitement, the community, and for the forcing function to get on the treadmill even on days when I’m not “feeling it.”

Alas, I’m not very proud of any of my fall race times, but I am glad that I’ve managed to keep up running after the motivation of Kilimanjaro has entered the rear-view mirror, and I’m happy that I recently managed to sneak up on running my longest-by-far distance.

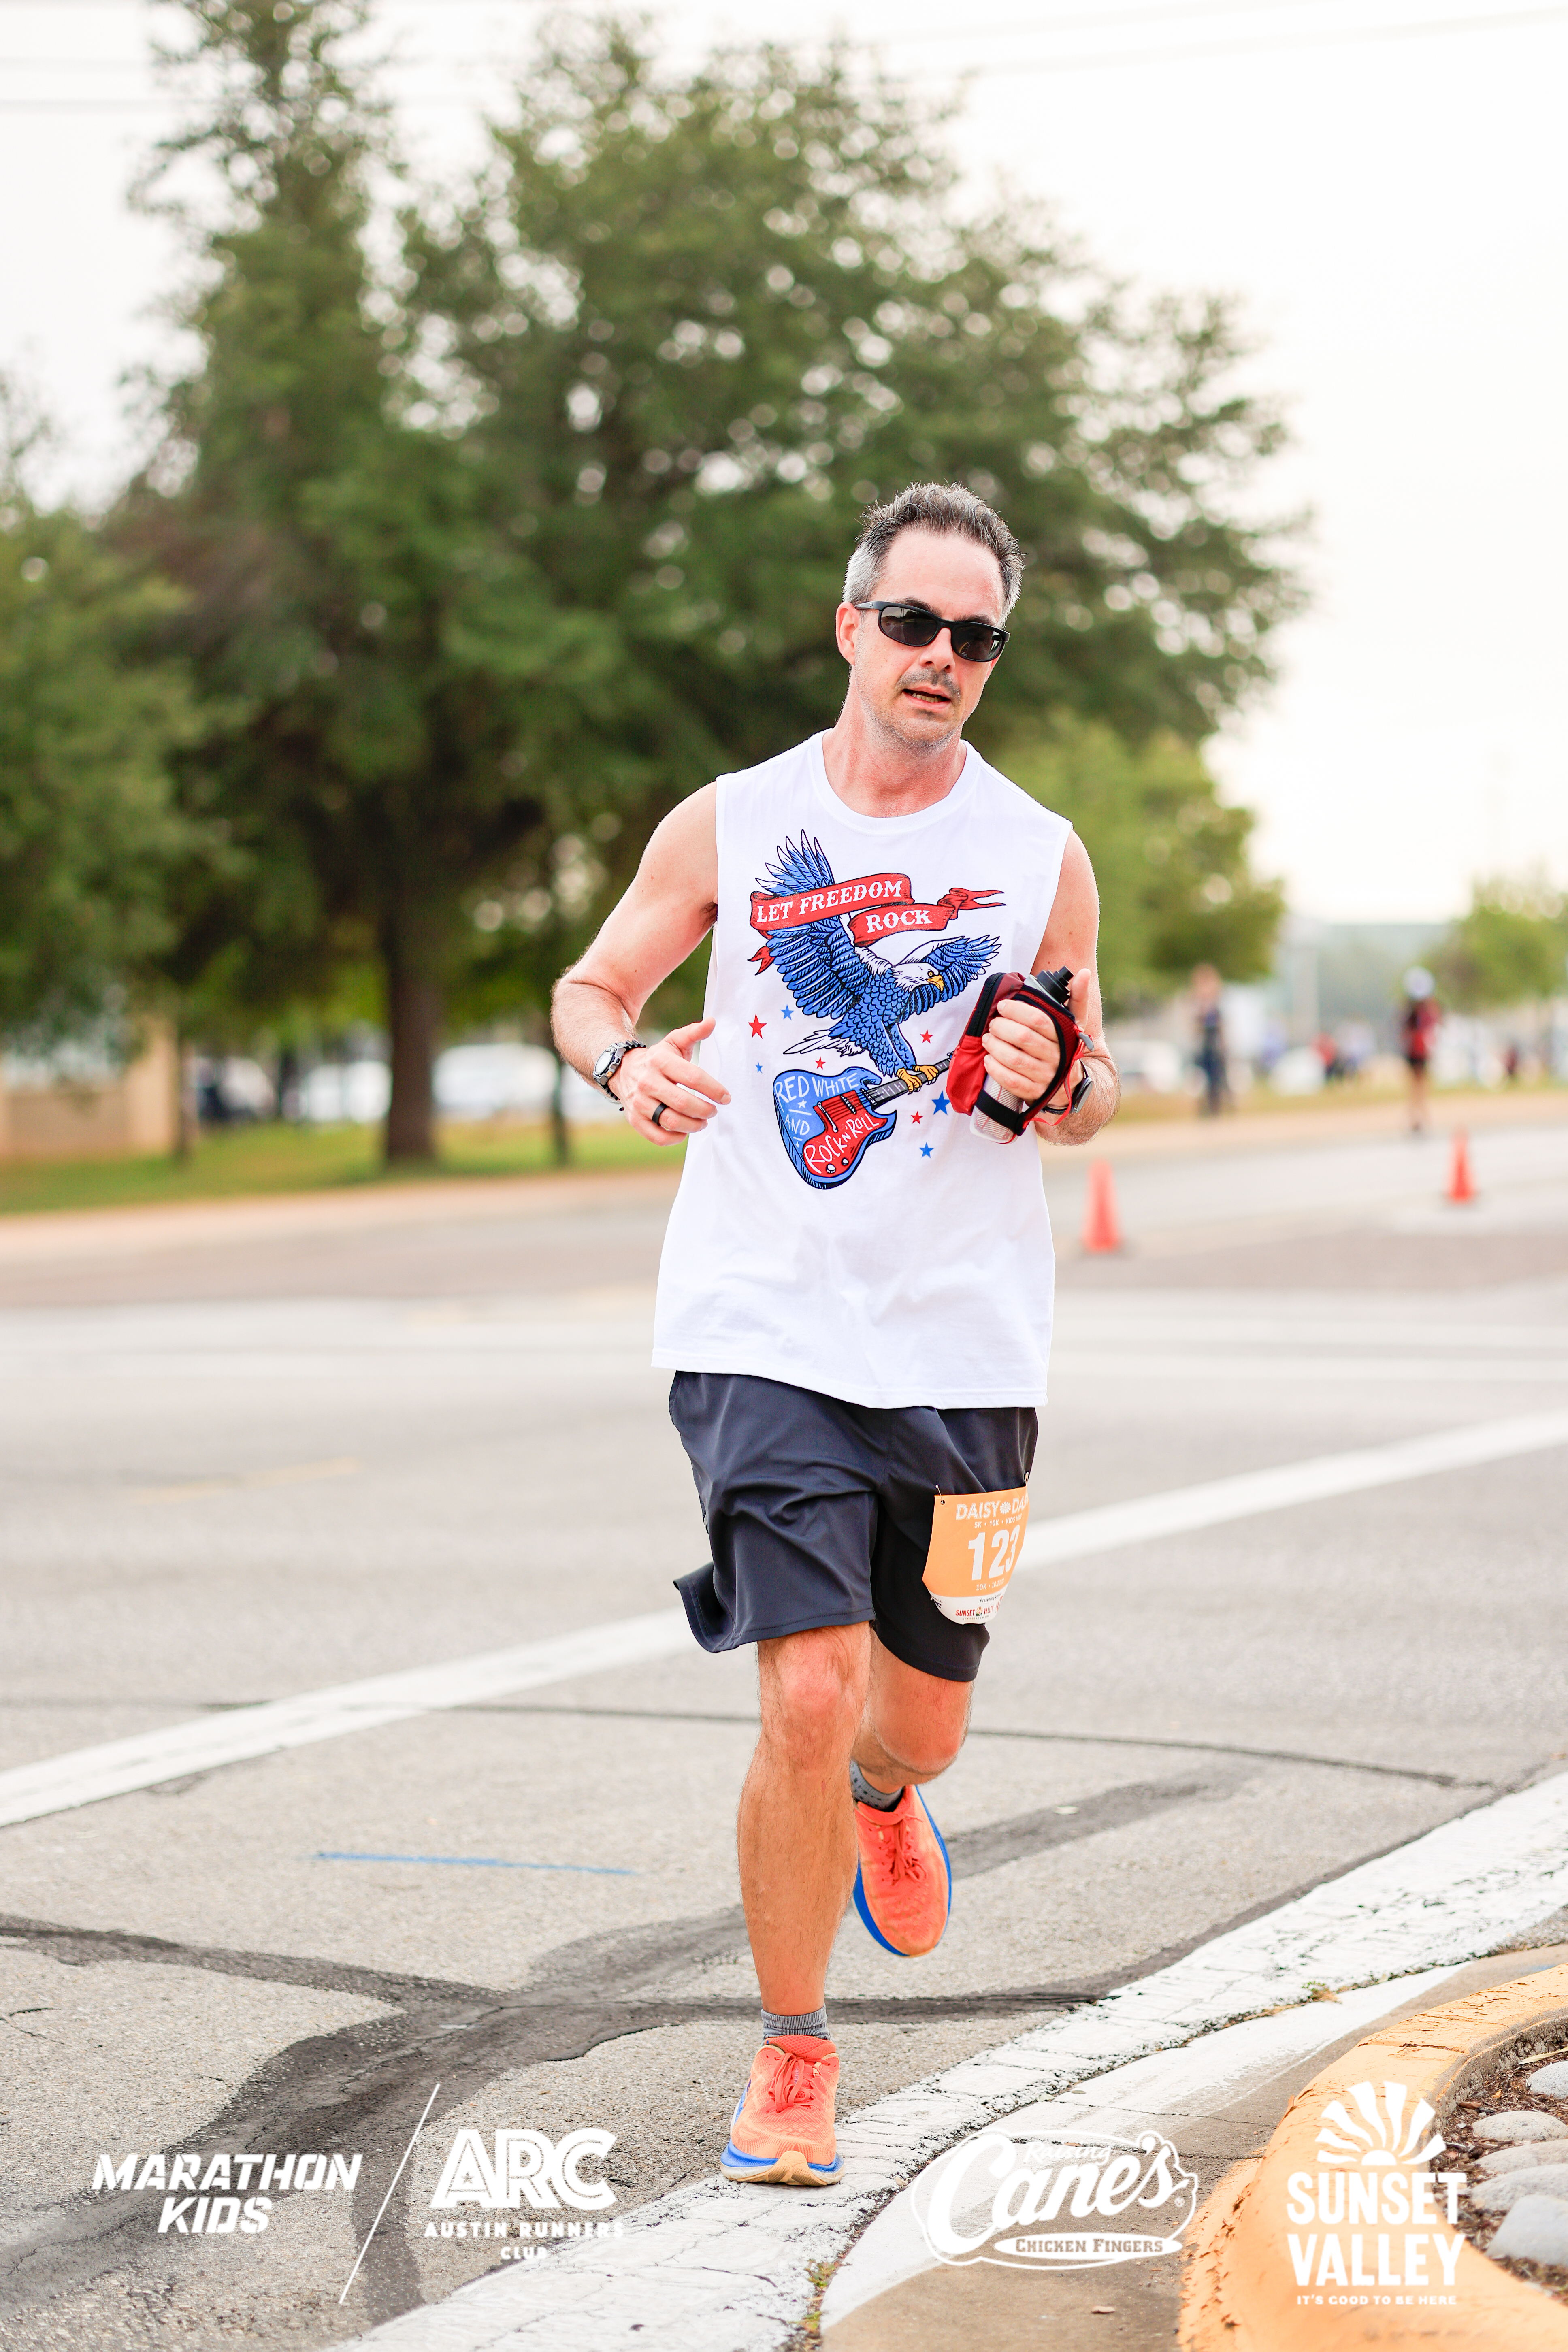
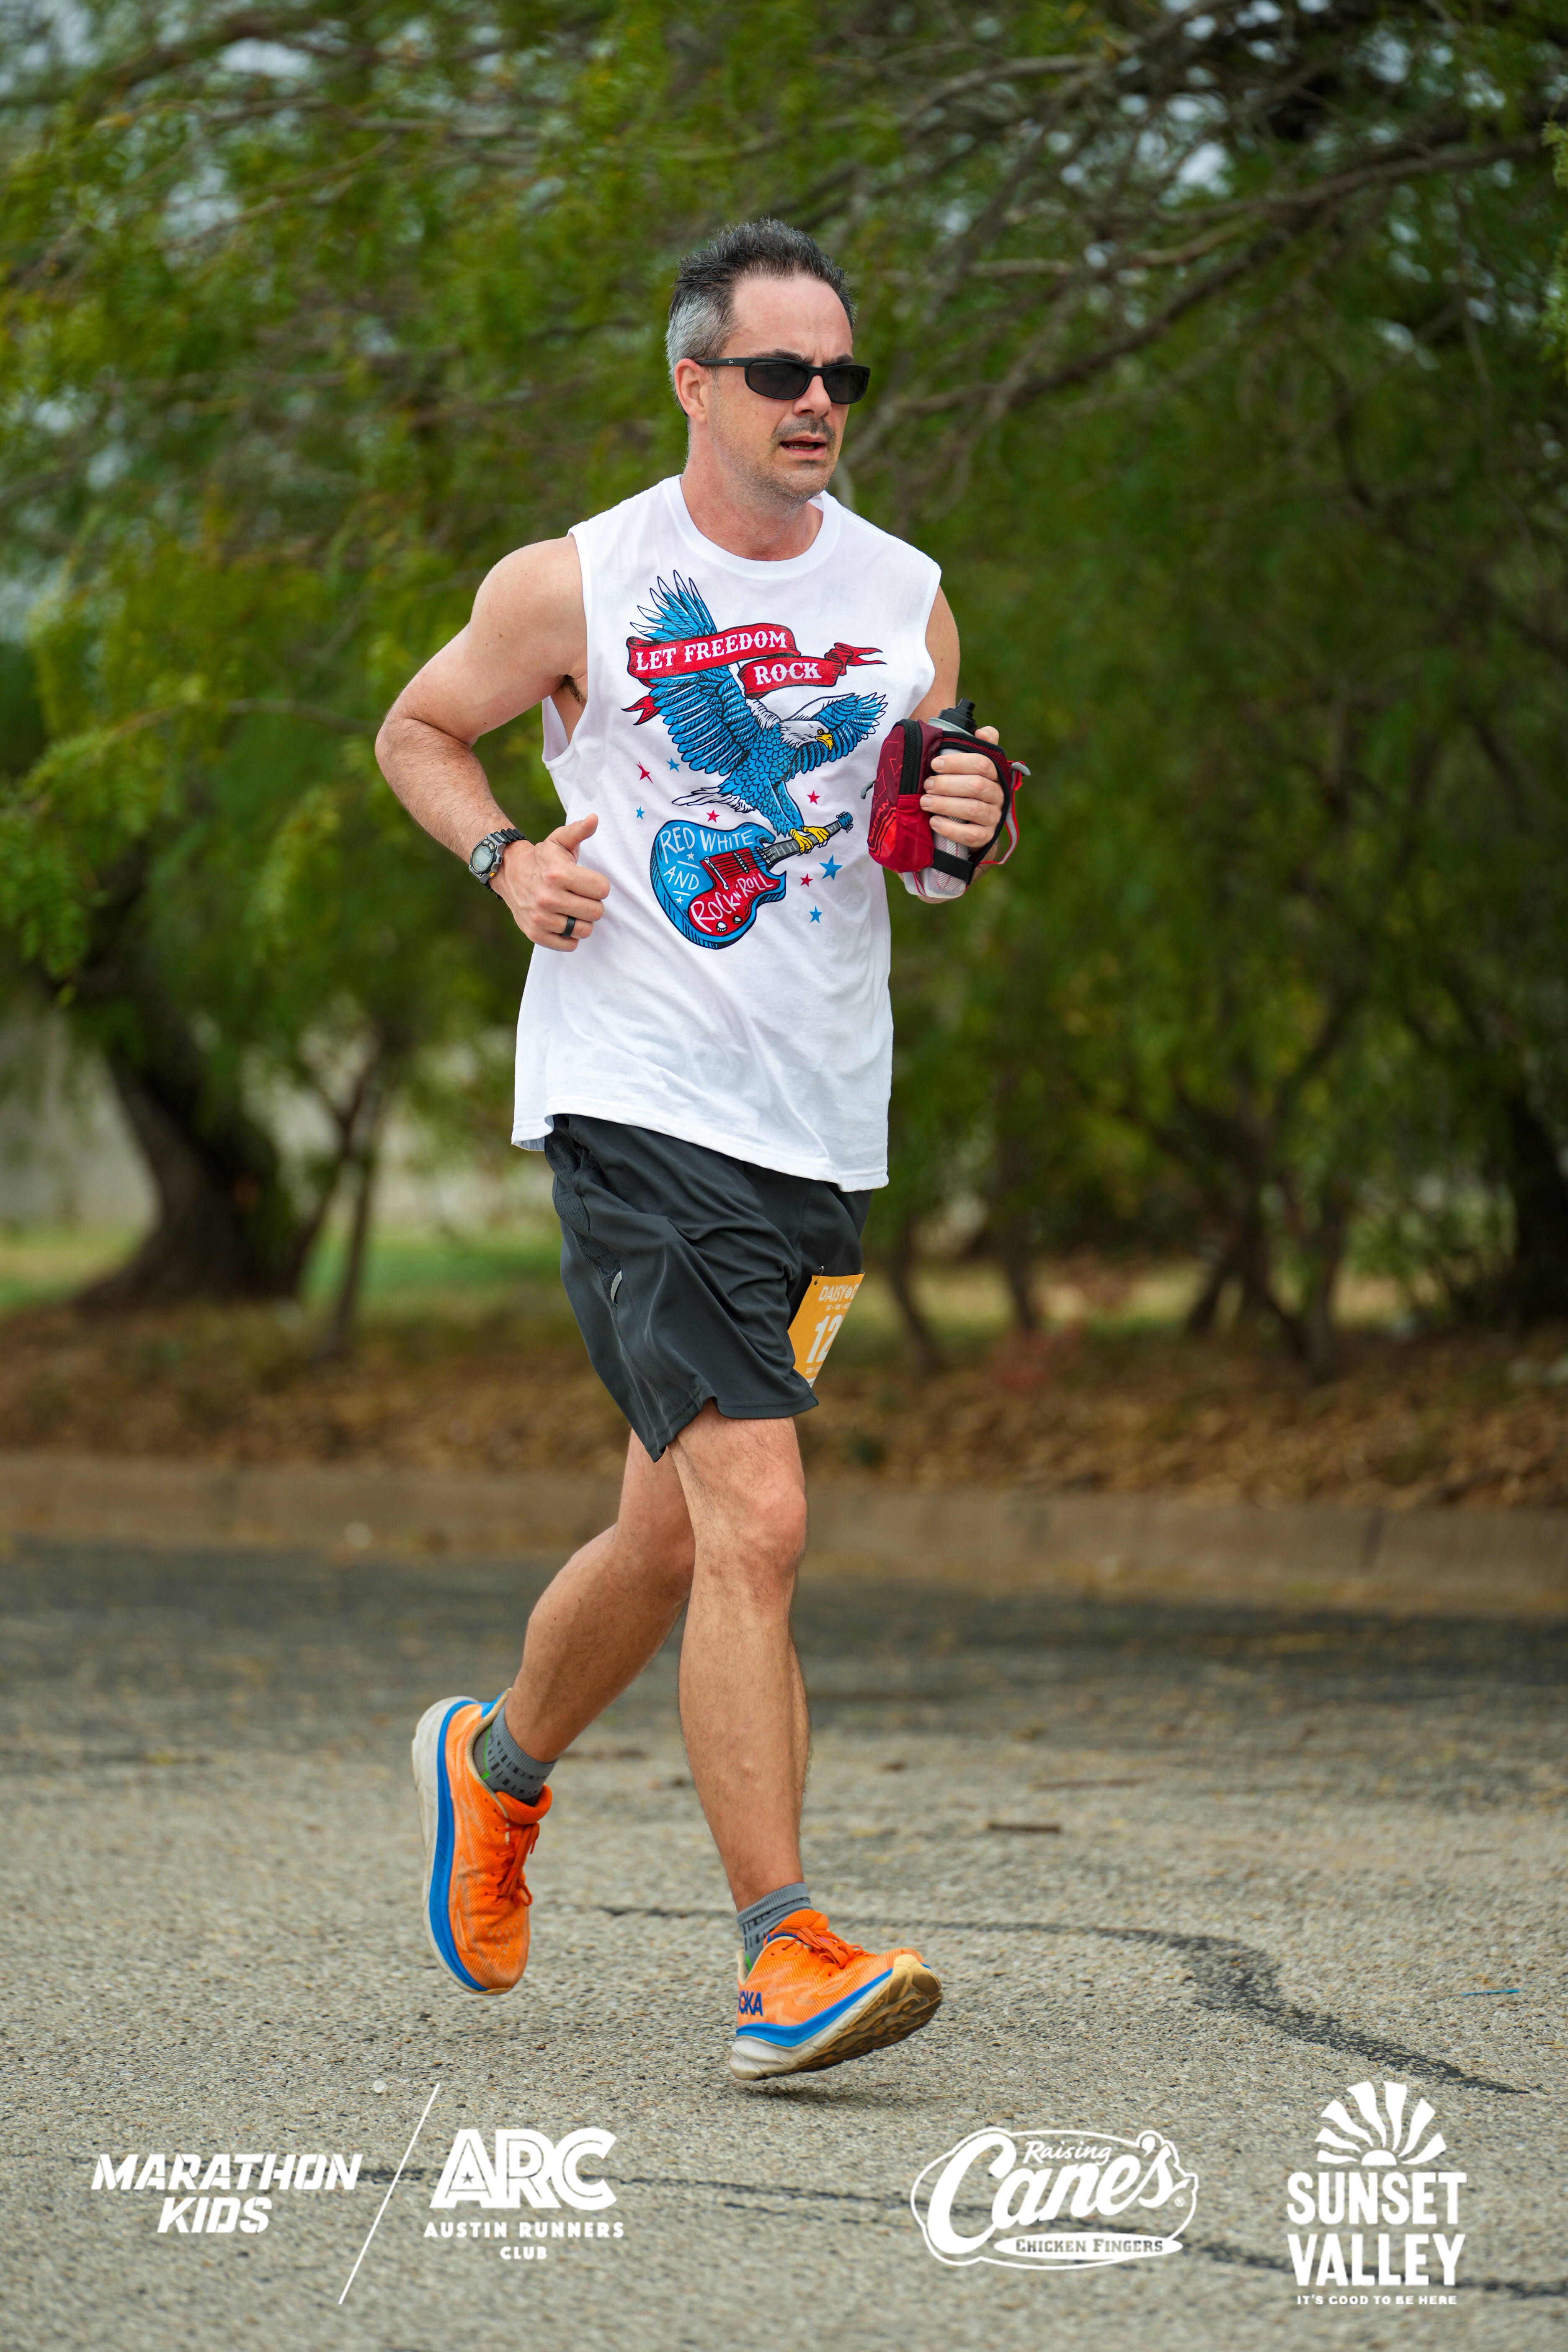
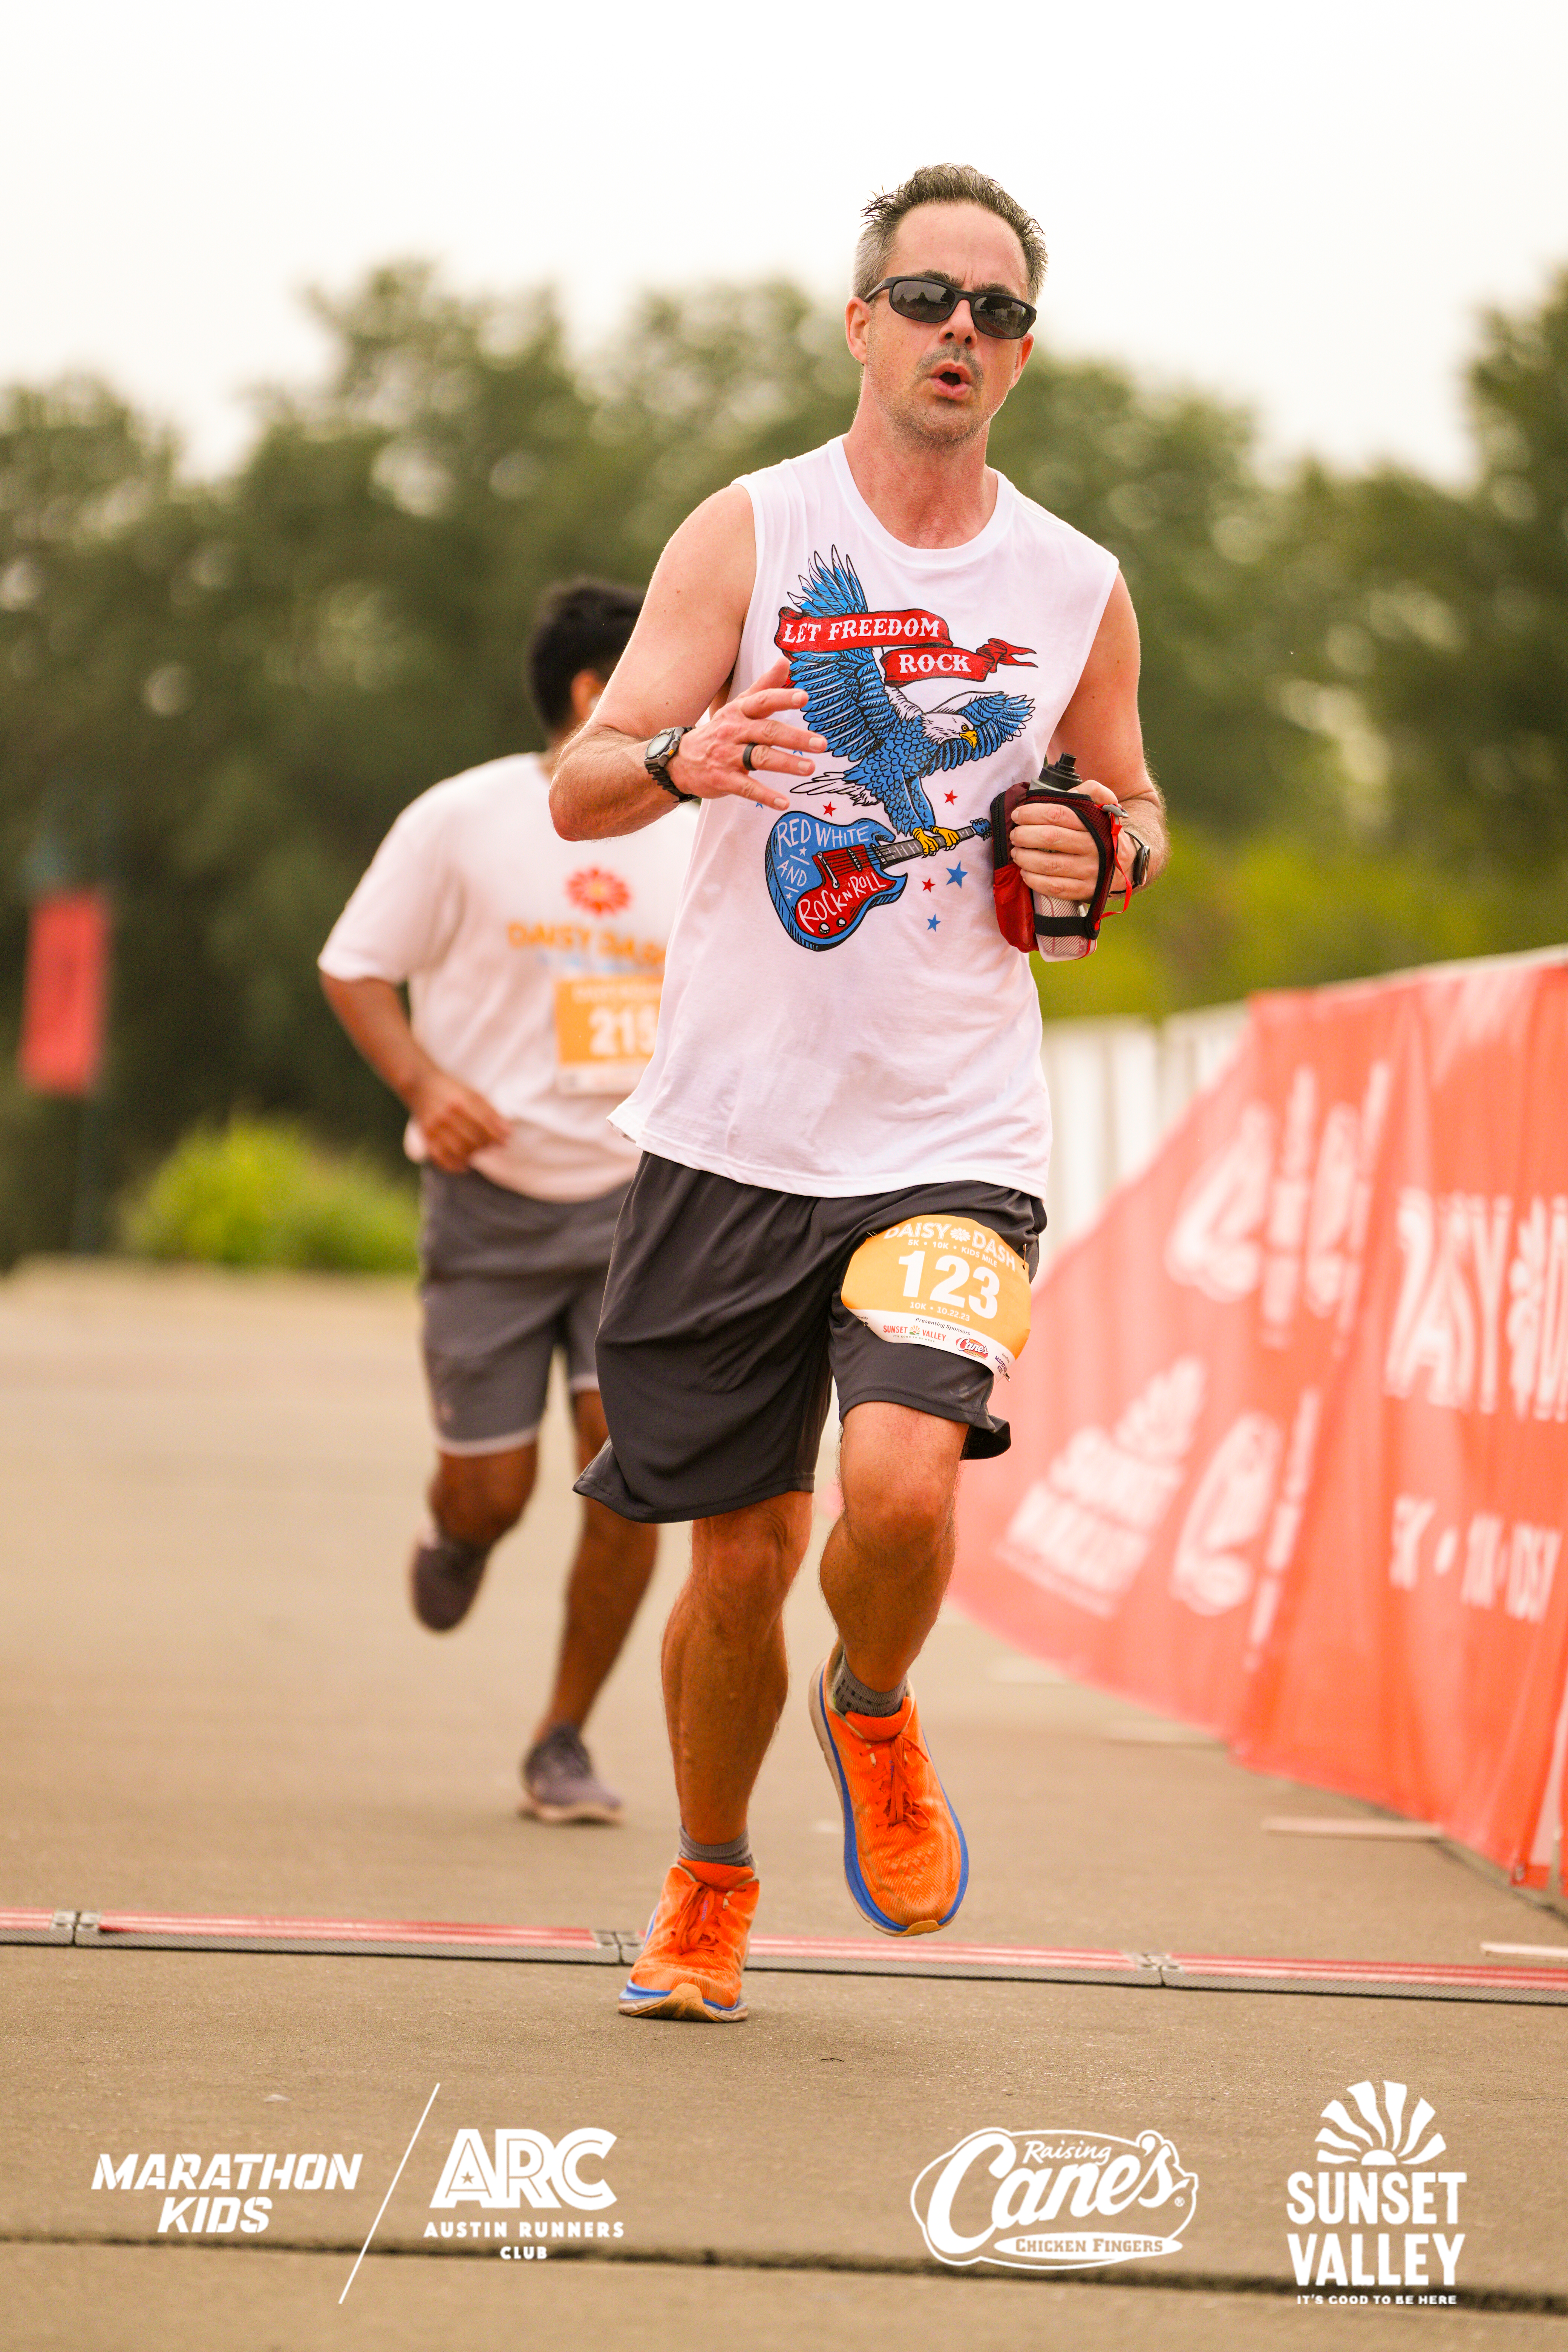
Daisy Dash 10K – 10/22

I had lucky bib #123 for this run. The course wasn’t much to look at, but was pleasant enough, looping around a stadium and a few shopping centers in “Sunset Valley” on the south side of Austin. I was worried going out that my lower back had been sore for a few days, and my belly felt slightly grumbly, but once I started running, neither bothered me at all for the next few hours. Thanks, body!

It was a 68 and breezy; a bit humid, but not nearly as bad as the Galveston Half I ran 9 months ago. I brought along an iPhone and Bluetooth earbuds and for my second race without music, after having stupid technical problems. In Galveston, my earbud died, and this time, I’d failed to download any music. Doh!

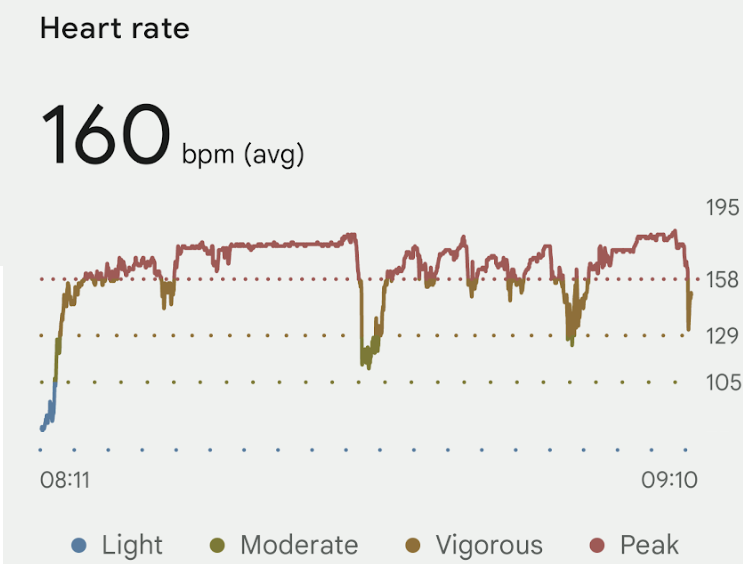
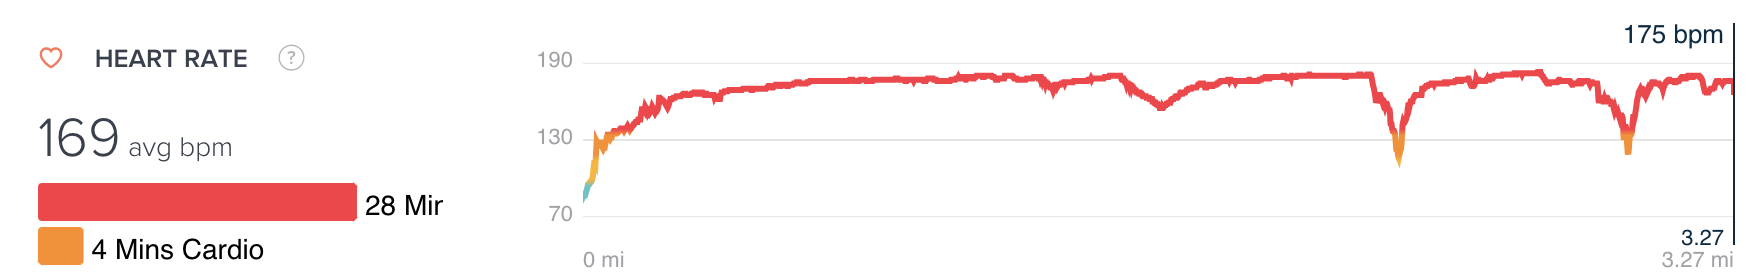
I burned 910 calories, and while my heart rate wasn’t awesome, it recovered quickly whenever my pace dropped.

I started out reasonably strong, finishing the first 5K in 26:39. I was wearing my Fitbit watch, but immediately abandoned any attempt to use it to monitor my pace during the run. I’m pleasantly surprised to find that I naturally settled into the exact 7mph pace that is my most common treadmill default.

Sadly, after the first 5K, I was panting and started taking 30 to 90 second walking breaks every three quarters of a mile or so, dropping my pace significantly in the back half of the race.

I tried to psych myself up with thoughts of Kilimanjaro and how short this race was (only 10K! I keep thinking), but I never got into that heavenly rhythm where the minutes just slide by for a while.

Still, I vowed to finish in under an hour, and in the last mile I was excited that I might beat 58 minutes, putting me about 5 minutes behind my second Cap10K in the spring, and still 10 minutes faster than my first real-world 10K.

Ultimately, I finished in 57:40:

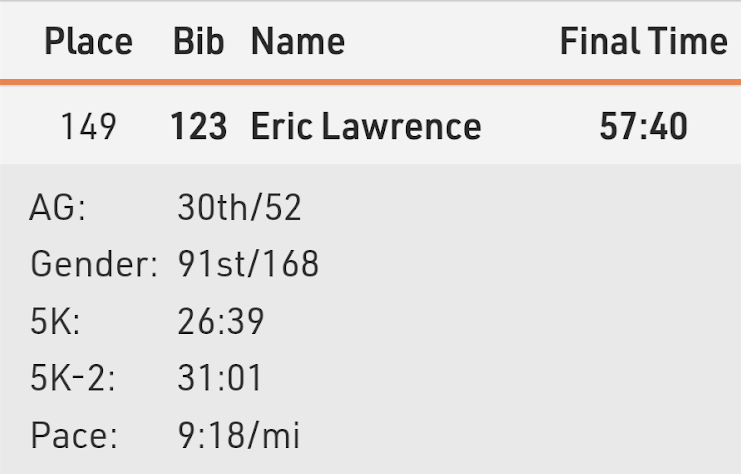
While my arches felt a bit sore after the race (pavement is clearly much harder on me than my treadmill), I felt like running an extra four miles wouldn’t’ve been a nightmare… good news for the “Run for the Water” 10 miler coming up in two short weeks. But first, a charity 5K.

Microsoft Giving Campaign 5K – 10/27

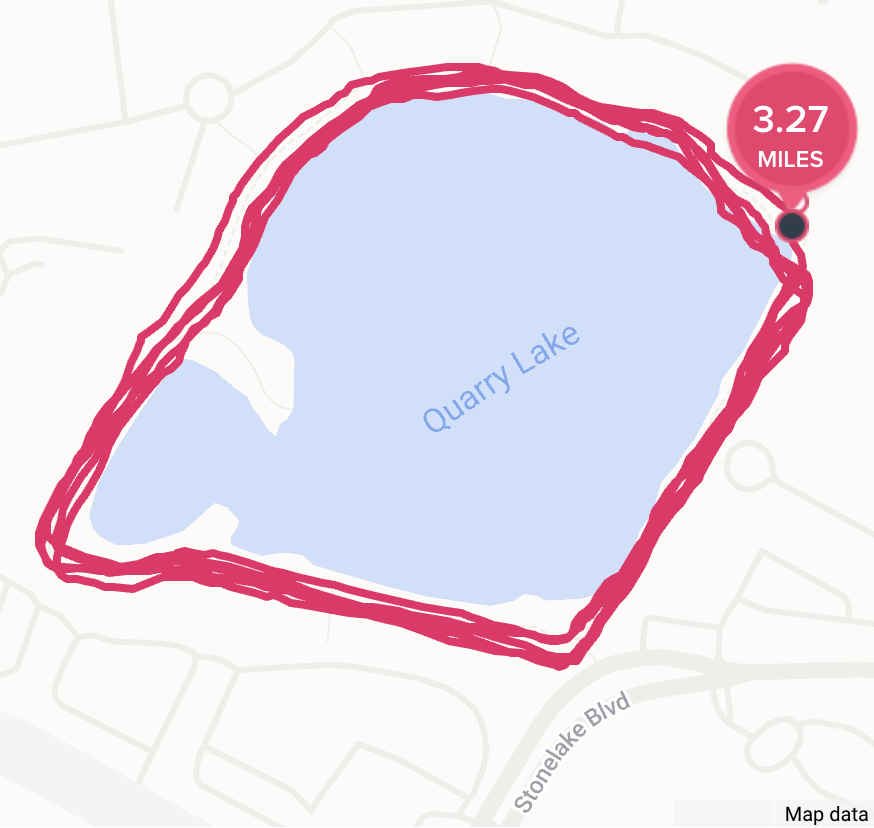
The Microsoft Giving Campaign’s charity 5K consisted of five laps around a small lake near Microsoft’s north Austin office. It was fun to meet other Microsoft employees (many of whom started during the pandemic) and go for a fun run around the private Quarry Lake trail.

Alas, I had a hard time with my pacing and less fun than I’d expecting dodging the mud puddles.

In total, it took me 32:41 to run the slightly-extended (3.27) course.

Last year’s 5K was on a different course and I’d gone out too fast, ultimately needing to walk in the third mile, such that when I finished it, I turned around and ran the full course again, this time at a steady pace. While I don’t seem to have recorded my times anywhere, I think both runs were around 27 minutes.

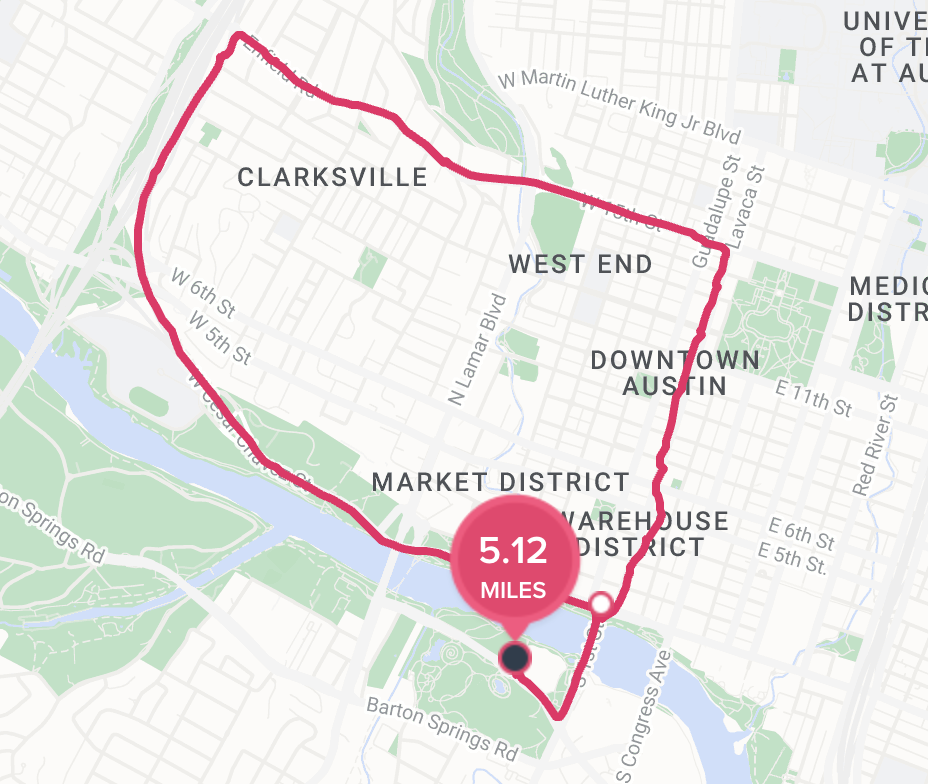
Run for the Water – 10 Miler 11/5

The weather for the race was nearly perfect. I was nervous, having remembered last year’s race, but excited to revisit this race with another year’s worth of running under my belt.

I managed the steep hill at mile 5.5 well, but fell off pace at miles 8 and 9.

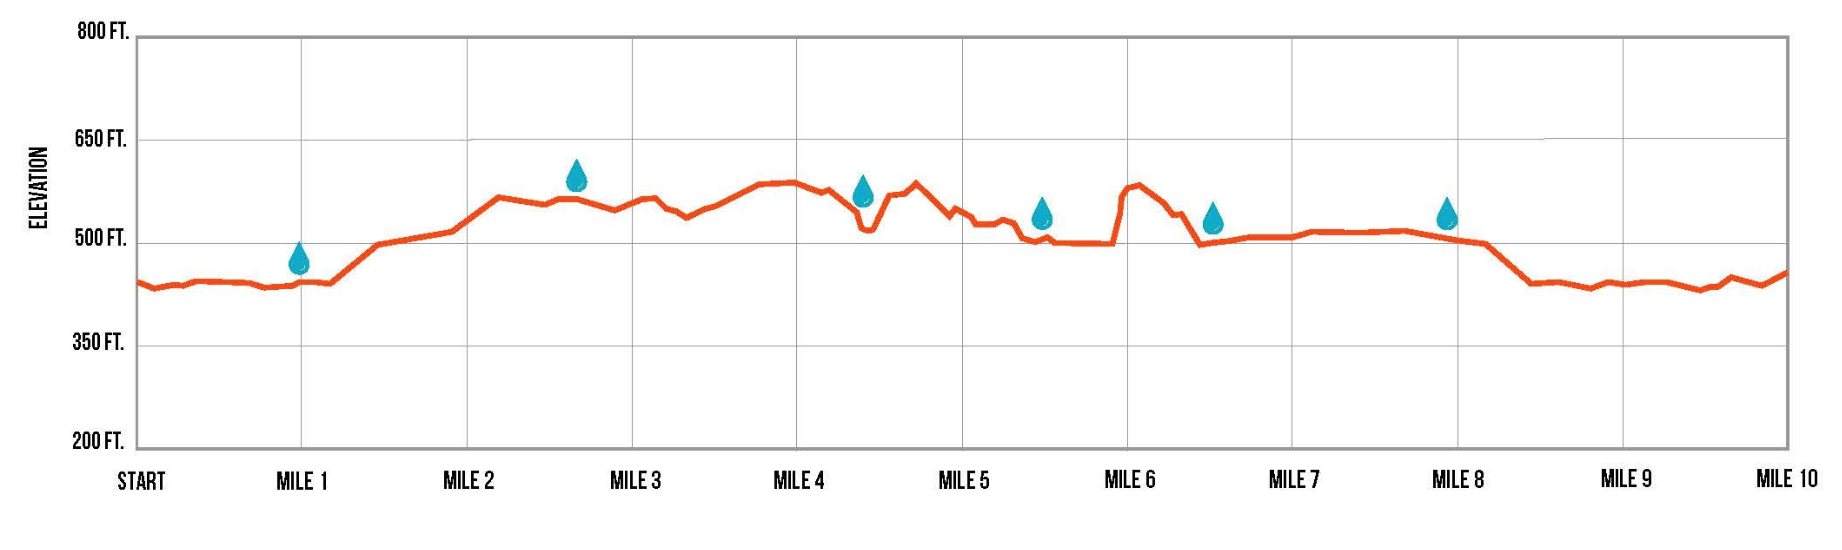
Sprinting at the end, my sunglasses went flying off my shirt; embarrassingly, I had to loop back into the finishers’ chute after crossing the finish line to collect them.

I finished in 1:38:05, a pace of 9:48, a somewhat-disappointing 9:08 slower than last year‘s race. Ah well.

Turkey Trot 5-Miler 11/23

I arrived for the Thanksgiving day race very early and ended up spending almost an hour outside before the race began, getting a bit colder than I’d’ve liked. I warmed up quickly when the run began.

I finished in 45:45, a pace of 9:09, a bit (1:39) slower than last year.

Shortly before the race started, I made the poor decision to eat a free granola bar and it didn’t sit well during the run. After sprinting through the finishers chute, I spent a panicked half-minute trying to find a convenient place to throw up amongst the thousands of bystanders until my heart calmed down and the urge subsided.

Virtual Decker Challenge Half 12/9

Having surveyed the boring Decker Challenge course last year while driving by during my missed half, I decided to sign up for the virtual option this year. The 2022 shirt (made by Craft) has become one of my favorites, and I wore it constantly on Kilimanjaro, including on summit day. I registered for the Virtual event to collect this years’ shirt, but alas, it turned out to be a disappointing no-name black long-sleeve tech shirt. There were basically no other perks to the virtual race — no medal, and nowhere even to report your virtual results. Bummer.

For the race itself, I chose to repeat the Jackson Hole half that I ran last year, beating last year’s time by almost 4 minutes, with a time of 2:00:20. This wasn’t a great time, but I was grateful for it: I’d had quite a bit of wine with dinner on Friday night, but had to run on Saturday morning because on Sunday I was taking my eldest to the Eagles/Cowboys game.

Virtual London Marathon 12/17

On this last weekend before the holidays, with my kids partying at their mom’s and my housemate out of town on a cruise, I was bored and starting to feel a bit stir crazy. I decided I’d run a marathon on my treadmill, picking 2021 London with Casey Gilbert. Unfortunately, the race was broken up into segments, so each time I had to switch to the next segment ended up being an “aid station” where I’d refill my water bottle or grab another stroopwafel.

The first half went great– I ran at a constant pace and finished in 1:55, feeling good and ready to keep going; my relatively slow pace kept my heart rate down. I finished the first twenty miles in a respectable 3:04:30, starting to worry that finishing in under 4 hours was going to be tough, but achievable. Unfortunately, things fell apart in miles 21 to 25, and my pace dropped dramatically; even though my heart rate was well under control, my legs were tired and I was beat. I rallied for the final three quarters of a mile back to 7mph, finishing with a somewhat disappointing but perhaps unsurprising 4:20:10.

Still, I’m proud of this race– while it was undoubtably much easier on the body than a real-world marathon, it was in no way easy and I never gave up.

After cooling down, I showered, ate, and caught “Love Actually” at the Alamo Drafthouse for the afternoon. My FitBit reported that I cracked 45000 steps for the day. My intake of three running stroopwafels, two bananas, a leftover fajita, a salad, a steak and vegetables probably did not cover the 4000+ calories I burned in the run.

Two days later, I’m still sore, although all three blisters have mostly faded away.

Early 2024 Races

I’ve got a good slate for early 2024, running the 3M Half again in January, the Galveston Half in February, and the Capitol 10K in April. I really hope to beat last year’s times in the Half Marathons (slow and steady ftw!), but don’t expect I’ll be able to beat my 2023 Cap10K time of 52:25.

Defense Techniques: Blocking Protocol Handlers

Application Protocols represent a compelling attack vector because they’re the most reliable and cross-browser compatible way to escape a browser’s sandbox, and they work in many contexts (Office apps, some PDFs handlers, some chat/messaging clients, etc).

Some protocol handlers are broadly used, while others are only used for particular workflows which may not be relevant in the user or company’s day-to-day workflows.

The Edge team can already block known-unsafe protocol schemes via a browser Component Update, but that only likely to happen if the scheme is broadly exploited across the ecosystem.

An organization or individual may wish to reduce attack surface by blocking the use of unwanted protocol handlers.

To block access to a given protocol handler from browsers, you can set the URLBlocklist policies in Chrome and Edge to prevent access to those protocols from within the browser.

For example, in 2022, the ms-appinstaller handler had a security bug and many organizations that did not need this handler for their environments wished to disable it. They can set the policies:

REG ADD "HKEY_LOCAL_MACHINE\SOFTWARE\Policies\Microsoft\Edge\URLBlockList" /v "1" /t REG_SZ /d "ms-appinstaller:*" /f

REG ADD "HKEY_LOCAL_MACHINE\SOFTWARE\Policies\Google\Chrome\URLBlockList" /v "1" /t REG_SZ /d "ms-appinstaller:*" /f

After the policy is set, attempt to navigate the browser to the protocol will show an error page:


After the 2022 incident, the App Installer team also created a specific group policy to disable the MS-AppInstaller scheme within the handler itself:

REG ADD "HKEY_LOCAL_MACHINE\SOFTWARE\Policies\Microsoft\Windows\AppInstaller" /v "EnableMSAppInstallerProtocol" /t REG_DWORD /d "0" /f

When the App Installer protocol is disabled within the handler itself, invoking the protocol simply shows an error message:

Stay safe out there!

-Eric

PS: On Windows 11 today, unfortunately, there’s not always a simple way to block an arbitrary scheme for the system as a whole, unless the protocol handler application can be uninstalled entirely.

The Windows Set a default for a link type settings pane only allows you to choose a different Microsoft Store app that offers to support the protocol scheme, preventing you from unsetting the scheme entirely or pointing it to a harmless non-handler (e.g. Calculator).

To address this, we have to tell Windows that our generic little executable (saved to C:\windows\alert.exe) knows how to handle the ms-appinstaller protocol scheme, by listing it in the RegisteredApplications key with a URLAssociations key professing support:

Windows Registry Editor Version 5.00

[HKEY_CLASSES_ROOT\com.bayden.alert]

[HKEY_CLASSES_ROOT\com.bayden.alert\shell]

[HKEY_CLASSES_ROOT\com.bayden.alert\shell\open]

[HKEY_CLASSES_ROOT\com.bayden.alert\shell\open\command]
@="\"C:\\windows\\alert.exe\" \"%1\""

[HKEY_CURRENT_USER\Software\RegisteredApplications]
"BaydenAlert"="SOFTWARE\\Bayden Systems\\Alert\\Capabilities"

[HKEY_CURRENT_USER\Software\Bayden Systems\Alert]

[HKEY_CURRENT_USER\Software\Bayden Systems\Alert\Capabilities]

[HKEY_CURRENT_USER\Software\Bayden Systems\Alert\Capabilities\URLAssociations]
"ms-appinstaller"="com.bayden.alert"

After we do this, we can change the protocol handler app from the real one to our stub:

…such that subsequent attempts to invoke the handler are harmlessly displayed:

Attack Techniques: Steganography

Attackers are incentivized to cloak their attacks to avoid detection, keep attack chains alive longer, and make investigations more complicated.

One type of cloaking involves steganography, whereby an attacker embeds hidden data inside an otherwise innocuous file. For instance, an attacker might embed their malicious code inside an image file, not in an attempt to exploit a vulnerability in image parsers, but instead just as a convenient place to stash malicious data. That malware-laden image file may then be hosted anywhere that allows image uploads. There are plenty of such places on the public internet, because image file types are generally not considered dangerous.

In the recent Diamond Sleet attack, the attackers embedded the second stage of the attack as data inside of a PNG file and hosted that file on three unwitting web services, including the popular Imgur and GitHub services. The first stage of the attack code reaches out to one of three URLs, downloads the image, extracts the attack code, decrypts it, and runs the resulting malware.

When parsing the malicious PNG file, we see that the attackers got lazy– they shoved their data in the middle of the file after the end of its final IDAT chunk and before the IEND chunk.

In this case, the attackers didn’t bother formatting their attack as a valid PNG chunk; even though the malicious data is only 498,176 bytes long, the bytes 1518E13A at the front of the malicious content would suggest to a PNG parser to expect almost 354MB of data in the chunk.

But none of that matters to the attacker’s code — they don’t need to parse the file as if it were legitimate, they just grab the part of the file they care about and ignore the rest.

Developers of malicious browser extensions have been using this approach for years, because they learned from experience that the JavaScript files inside extension uploads get more scrutiny from browsers’ web stores’ security reviewers than the other files in the extension packages.

Defenders who want to detect hidden code can try to look for anything suspicious: malformed chunks, unknown chunk types, trailing data, and suspiciously inefficient files (e.g. much larger than the pixel count would suggest). But ultimately, there’s no way to guarantee that you’ll ever detect embedded messages.

A sufficiently motivated attacker could encrypt their malware and then encode it as legitimate pixel data (say, the “random” pixels of the stars in the sky) and there’s no way for a researcher to detect it without knowing the decryption routine. That said, finding an image’s URL inside a captured copy of the first stage or its network traffic is typically a pretty strong indication that there’s something malicious embedded in the file, because attackers tend not to bother downloading data they don’t need.

-Eric

Troubleshooting Edge (or Chrome) Broken UI

Last time, we looked at how to troubleshoot browser crashes. However, not all browser problems result in the tab or browser crashing entirely. In some cases, the problem is that some part of the browser UI doesn’t render correctly.

This most commonly occurs with parts of the UI that are written in HTML and JavaScript. In Chromium-based browsers, that includes the F12 Developer Tools and the pages served from chrome:// or edge:// urls.

Within Microsoft Edge, HTML-based UI also includes many of the new UI elements including the History/Favorites/Download Manager “Hubs”/bubbles and the sidebar on the right.

Debugging Built-in Pages

Sometimes, a built-in page will fail to function or render correctly, or might not show any content at all. For example, performing a search inside edge://settings might result in the page content disappearing entirely.

When this happens, you can simply hit F12 to open the browser’s F12 Developer Tools. The Console tab of the tools will show the JavaScript error that caused the problem. If you report the bug (Alt+Shift+I), including the Console tab’s content in your screenshot will make it simpler for the engineers to figure out what went wrong.

Debugging Developer Tools

Sometimes, one or more tabs in the F12 Developer Tools does not load as expected. For example, here’s a case where the Application tab doesn’t load:

Fortunately, you can use a second instance of the Developer Tools to debug the Developer Tools!

First, undock the DevTools into their own window by clicking the menu inside the tools, then set the Dock location to undocked.

Next, use the Developer Tools to debug the Developer Tools by clicking into the DevTools window and hitting the Ctrl+Shift+I keyboard shortcut. A second instance of the DevTools will appear, debugging the first instance of the DevTools:

The Console tab of the second Developer Tools instance will show any script errors from the first:

Debugging Hubs

Within Edge, various flyouts from the toolbar are implemented as small HTML content areas that appear when you click various toolbar buttons. To debug these flyouts:

  1. Open a second Edge window and navigate it to edge://inspect.
  2. Click the Pages link on the left-hand side.
  3. In the first window, open the problematic Hub UI (e.g. hit Ctrl+H to open the History hub).
  4. Click the Inspect link under the page that appears in the Pages list:

Alternatively, you could try loading the Hub as a top-level page by using its undocumented URL (e.g. navigate to edge://downloads/hub to open the Edge Downloads page in its Hubs mode).

Using DevTools to debug the browser itself feels like a super-power.

-Eric

Troubleshooting Edge (or Chrome) Browser Crashes

In the modern browser world, there are two types of crashes: browser crashes and renderer crashes.

In a browser crash, the entire browser window with all of its tabs simply vanishes, either on startup, or at some point afterward. The next time the browser starts, it should recognize that the last time it exited was unexpected and offer to recover the tabs that were open at the time of the crash:

Crash recovery prompt shown after restart

In contrast, in a renderer crash, one (or more) tabs will show a simple crash page with a "This page is having a problem" error message:

Edge’s Renderer Crash notification page

The Error code mentioned at the bottom of the page might help point to the cause of the problem. Sometimes if you search for this code on Twitter or Reddit you might see a recent set of complaints about it and learn what causes it.

Automatic Crash Reporting

Microsoft Edge uses a Microsoft crash-reporting system called Watson (after Sherlock Holmes’ famous assistant). When your browser or one of its tabs crashes, the system collects information useful for engineers to diagnose and fix the problem and uploads it to Microsoft’s servers for analysis. (Chrome includes a similar system, called CrashPad, which sends Chrome crash reports to Google).

Backend systems automatically sort crash reports into buckets, count them, and surface information for the browsers’ reliability engineers to investigate in priority order. These engineers constantly monitor the real-world crashes worldwide and work to send fixes out to users via updated versions (“respins“) as quickly as possible.

In the vast majority of cases, you don’t need to do anything to get a browser update beyond just waiting. Visiting about:help will kick off a version update check:

…but even if you cannot do that (e.g. because the browser crashes on startup such that you cannot navigate anywhere), Edge’s background updater will check for updates every few hours and silently install them. If you want to hurry it along, you can do so from the command-line.

about:crashes

You can see information about recent crashes by visiting the about:crashes page in the browser. If you end up talking to an engineer about a crash or post a question in a forum asking for help, posting the CAB ID and Bucket ID information from Edge’s crash report (or the Uploaded Crash Report ID from Chrome’s crash report) will allow browser engineers the ability to easily pull up the data from your crash.

ProTip: When sharing these ID values, please share them as text, not a screenshot; no one wants to try to retype 32 digit hexadecimal numbers from your grainy JPEGs.

Screenshot for this explanation only. Share text, not screenshots!

Bucket and CAB IDs often greatly enhances engineers’ ability to help you understand what’s going on.

If you’d like, you can click the Submit feedback button next to a crash and provide more information about what specifically you were doing that led to the crash. In most cases, this isn’t necessary, but it can be useful if you have a reproducible crash (e.g. it happens every time), and you were doing something that might otherwise be hard to reproduce (e.g. loading a non-public web page).

Self-Troubleshooting

What if the entire browser crashes on startup, such that you cannot visit the about://crashes page? Or you want to see whether you can change something about your browser to avoid the crash. In such cases, you might want to explore the following troubleshooting steps.

Troubleshooting: Try a new Profile

Some crashes are profile-dependent– a setting or extension in your profile might be the source of a problem. If you have multiple different browser profiles already, and you’re hitting a renderer crash, try switching to a different profile and see whether the problem recurs.

If you’re hitting a browser crash (which prevents you from easily switching profiles), try starting Edge with a new profile:

  1. Close all Edge instances; ensure that msedge.exe is not running in Task Manager. (Sometimes, Edge’s Startup Boost feature means there may be one or more hidden processes running.)
  2. Click Start > Run or hit Windows+R and enter msedge.exe –profile-directory=Rescue

If Edge opens and browses without crashing, the problem was likely related to something in your profile — whether a buggy extension, an experiment, or some other setting.

Troubleshooting: Change Channels

If you’re crashing in a pre-release channel (Canary, Dev, or Beta) try retreating to a more stable channel. The pre-release channels are expected to have crashes from time-to-time (especially Dev and Canary) — the whole point of publishing these channels is to allow the team to capture crash reports from the wild before those bugs make it into the Stable release.

If you’re crashing in the Stable channel, try the Dev channel instead– while the team generally tries to pull all fixes into the Stable channel, sometimes those fixes might make it into the Canary/Dev builds first.

Troubleshooting: Try disabling extensions

Generally, a browser extension should not be able to crash a tab or the browser, but sometimes browser bugs mean that they might. If you’re encountering renderer (tab) crashes, try loading the site in InPrivate/Incognito mode to see if the crash disappears. If it does, the problem might be one of your browser extensions (because extensions, by default, do not load in Private mode).

You can visit about:extensions to see what browser extensions are installed and disable them one-by-one to see whether the problem goes away.

Troubleshooting: Try running without extensions at all

In rare cases, a browser bug tickled by extensions might cause the browser to crash on startup such that you cannot even visit the about:extensions page to turn off extensions.

To determine whether a browser crash is related to extensions, follow these steps:

  1. Close all Edge instances; ensure that msedge.exe is not running in Task Manager. (Sometimes, Edge’s Startup Boost feature means there may be one or more hidden processes running.)
  2. Click Start > Run or hit Windows+R and enter msedge.exe –disable-extensions
  3. Verify that Edge opens correctly
  4. Visit edge://crashes and get the CABID/BucketID information from the uploaded crash report

Unfortunately, while in the “Extensions disabled” mode, you cannot visit the about:extensions page to manually disable one or more of your extensions — in this mode, the browser will act as if it has no extensions at all.

Troubleshooting: Check for Accessibility Tools

Sometimes, Chromium tabs might crash due to buggy handling of accessibility messages. You can troubleshoot to see whether Accessibility features are unexpectedly enabled (and try disabling them) to see whether that might be the source of the problem. See Troubleshooting Accessibility.

Troubleshooting: Check for incompatible software

If all of the browser’s tabs crash, or you see many different tab crashes across many different sites, it’s possible that there’s software on your PC that is interfering with the browser. Read my post about how to use about:conflicts page to discover problematic security or utility software that may be causing the problem.

Troubleshooting: Check Device for Errors

While it’s rare that a PC that worked fine one day abruptly stops working the next due to a hardware problem, it’s not impossible. That’s particularly true if the crash isn’t just a browser crash but a bluescreen of death (aka bugcheck) that crashes the whole computer.

In the event of a bluescreen or if the error code is STATUS_ACCESS_VIOLATION, consider running the Windows Memory diagnostic (which tests every bit of your RAM) to rule out faulty memory. You can also right-click on your C: drive in Explorer, choose Properties > Tools > Error Checking to check for disk errors.

If the crash is a bluescreen, you should also try updating any drivers for your graphics card and other devices, as many bluescreens are a result of driver bugs.

Advanced Troubleshooting: Try a different flavor

If you’re a software engineer and want to help figure out whether the crash is in Chromium itself, or just in Chrome or Edge, try running the equivalent channel of the other browser (e.g. if Chrome Dev crashes, try Edge Dev on the same URL).

Advanced Troubleshooting: Examine Dumps

Software engineers familiar with using debuggers might be able to make sense of the minidump files collected for upload to the Watson service. These .dmp files are located within a directory based on the browser’s channel.

For example, crashes encountered in Edge Stable are stored in the %LOCALAPPDATA%\Microsoft\Edge\User Data\Crashpad\reports\ directory.

-Eric

PS: Want to see what crash experiences look like for yourself?

To simulate a browser crash in Edge or Chrome, go to the address bar and type about://inducebrowsercrashforrealz and hit enter. To simulate a tab crash, enter about://crash instead.