Simply Making Simple Fixes Simple for Chromium

Google recently introduced a cool web-based editing tool for Chromium source code, a very stripped down version of the Willy Wonka tooling Googlers get to use for non-Chromium projects.

I’ve used this tool to submit two trivial change lists (CLs, aka PRs) to Chromium, but I was curious about whether this new feature would work for something not completely trivial, and while remaining simpler than the full Checklist for contributing to Chromium.

Let’s try it.

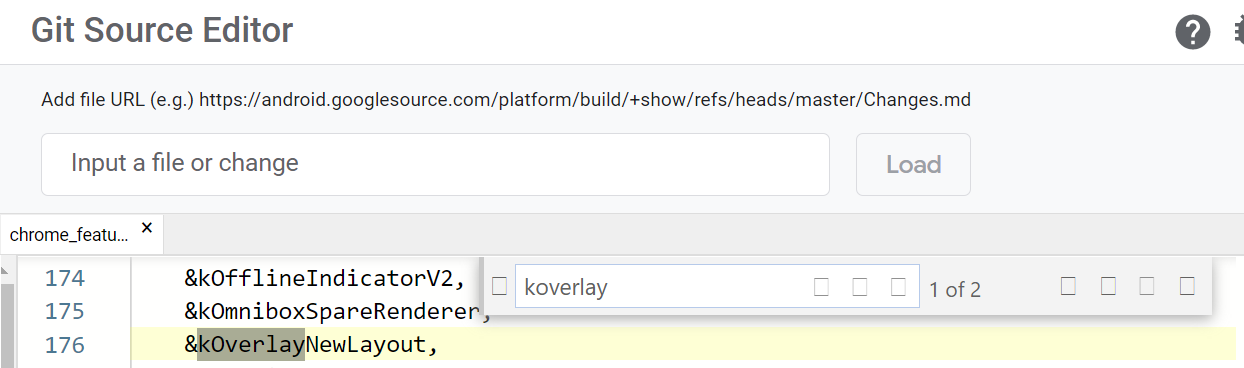
First, find an Available GoodFirstBug. Say, this one to remove an expired flag. Let’s search for the flag. Not too many hits:

Let’s click into the first hit to open it. Click Edit Code at the top right:

A web-based code editor opens:

Remove the &kOverlayNewLayout line and the function that references it later in the file. Use the navigation panel on the left to open the .h file corresponding and remove the declaration of the feature.

Open about_flags.cc and remove the lines referencing the flag:

Note that this will create orphan variables for the flag_descriptions that we need to go delete too. Go delete those from the flag_descriptions.cc and flag_descriptions.h files.

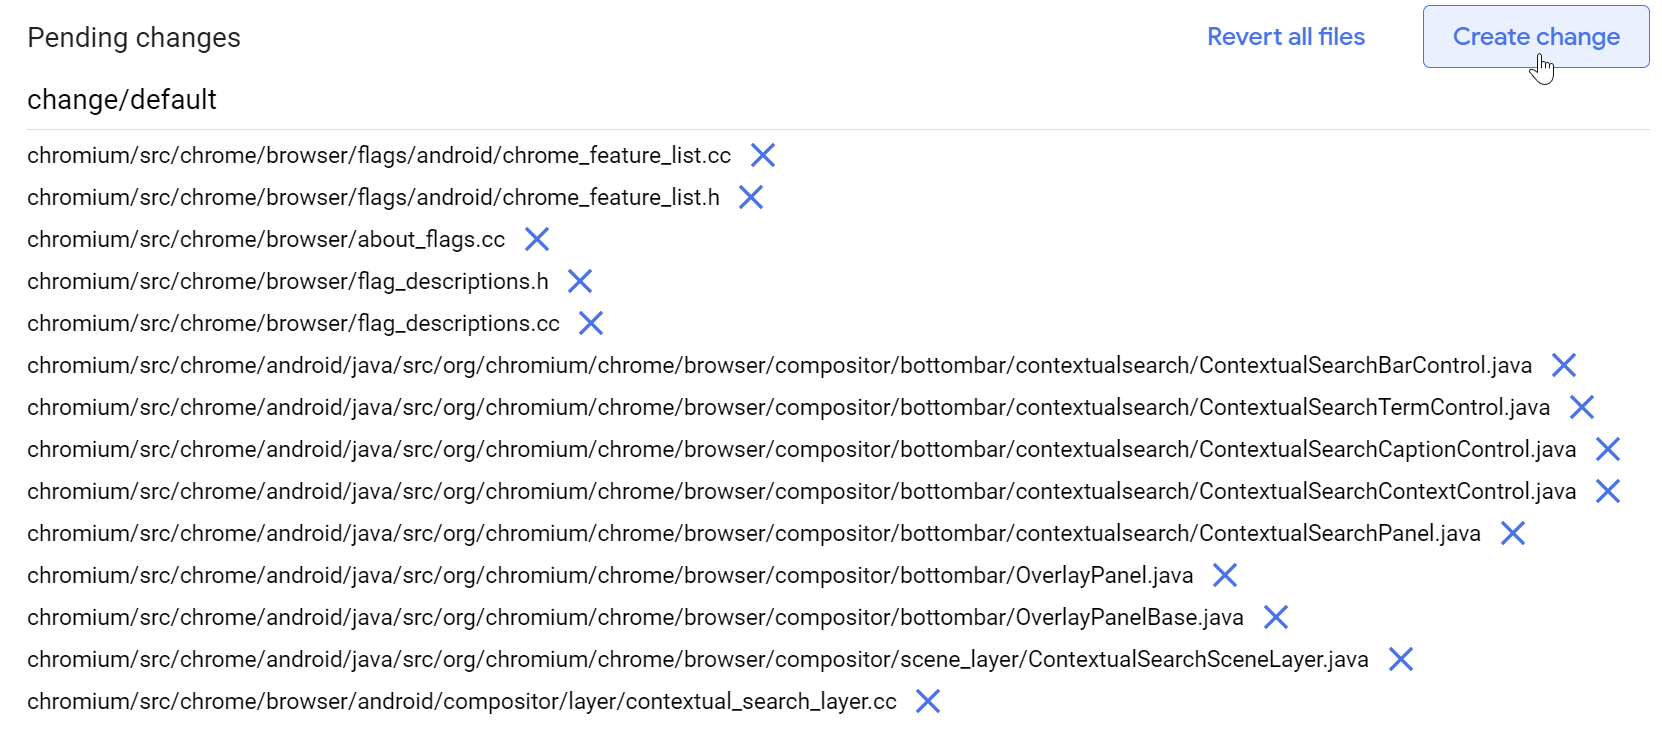
At this point, your Pending Changes pane contains all of the files with all of the hits that came up in the search.

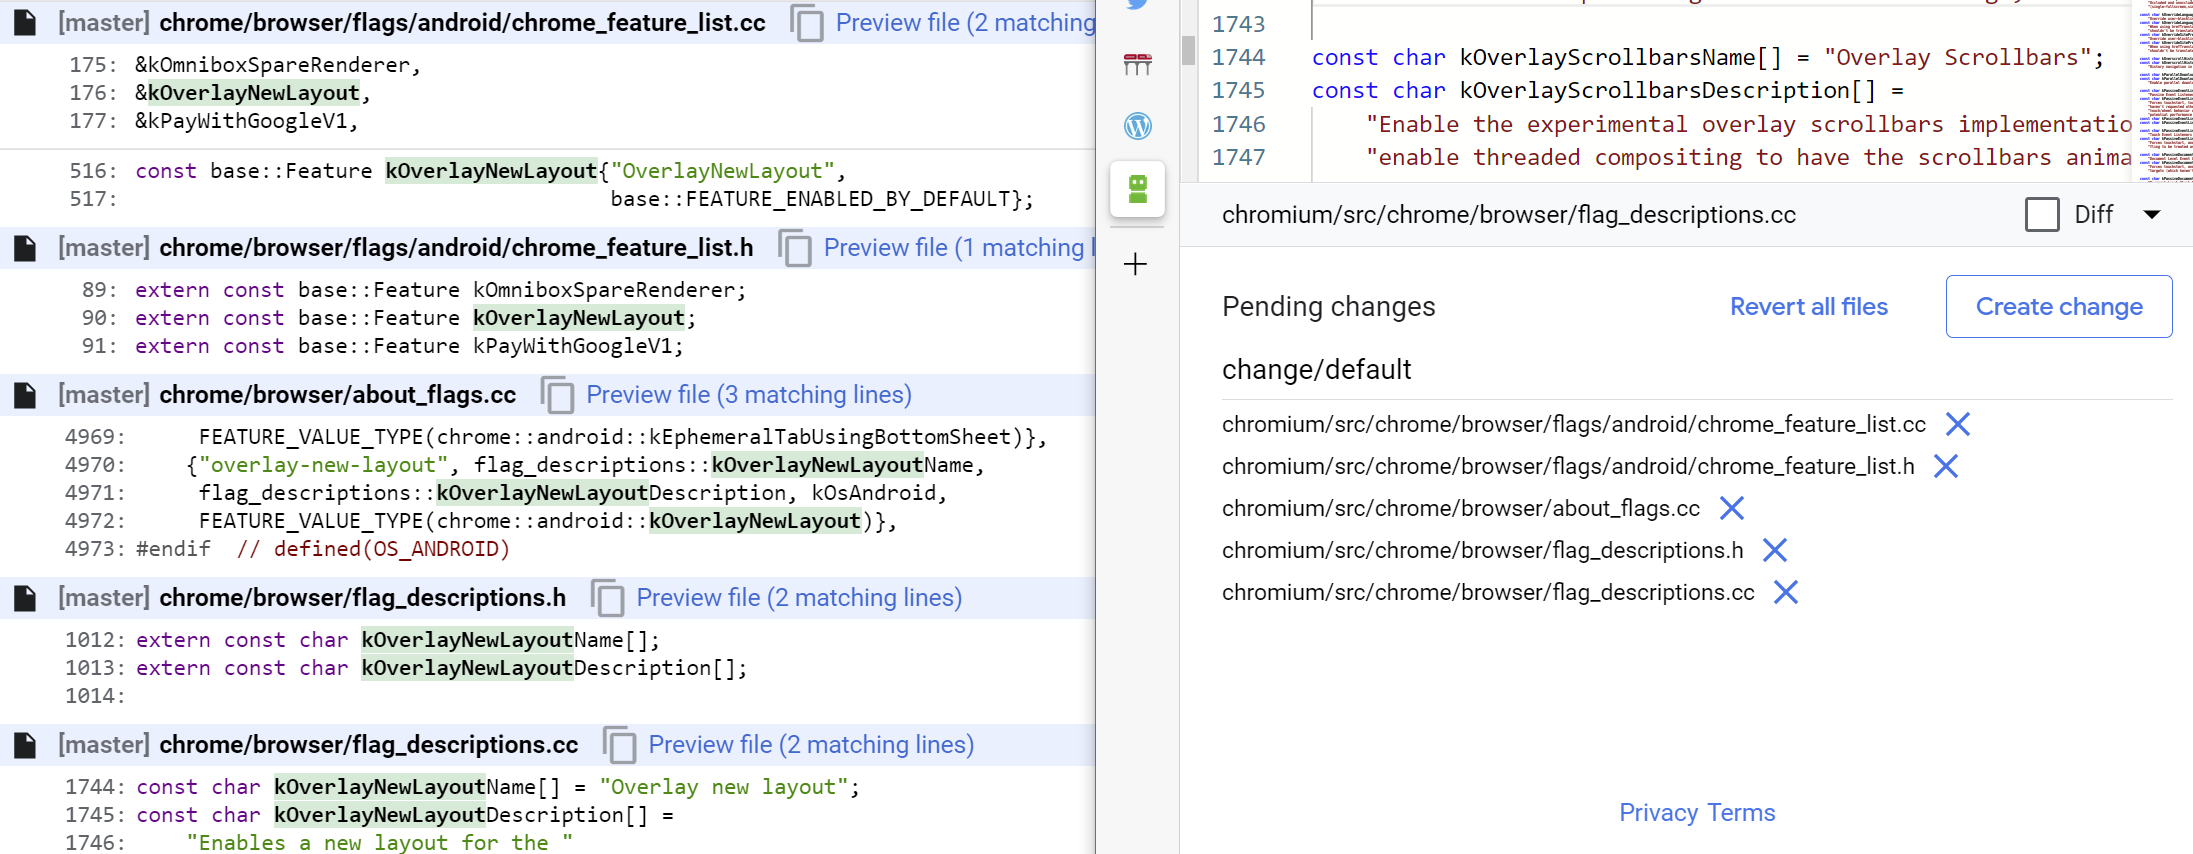
If we think we’re done, we can go hit the Create Change button to actually create the change for review.

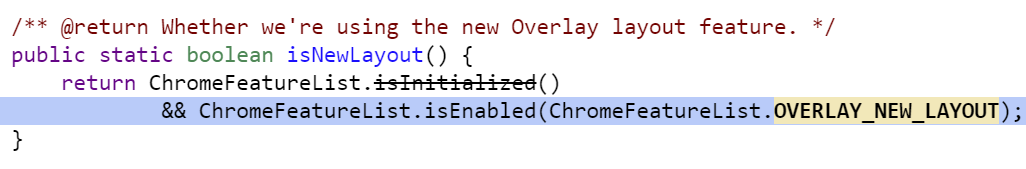
However, suspiciously, we haven’t actually found anything that respects the Feature we removed. If we instead search for OverlayNewLayout we see an additional hit appears:

Having worked on stuff like this before, I know that there’s some magical marshalling of feature values from C++ into Java-land (Android’s UI layer). So we need to go eliminate the use of the Java-side feature. Search for OVERLAY_NEW_LAYOUT.

Oof. There are 8 more files: 7 are Java and one is a similarly-named variable in a CC file. (It’s a variable in C++ code that set based on the feature’s state from the Java-side based on a resource ID. Sneaky sneaky).

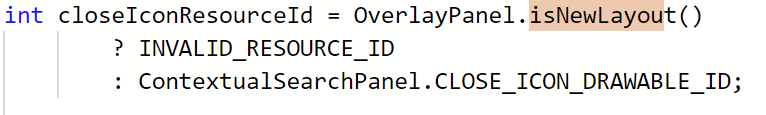
Worse, one of the early hits is this one:

… So we also need to remove this function entirely and update all of its callers to not check it. Fortunately, only two more files have references, but clearing up some of those implies that we might have resources that will become unused:

When we’re done pulling all the threads, the change has grown pretty big. Click Create change to put all of our changes together into a change list:

In the dialog that appears, enter a description of the changelist and click Create:

After a minute or so, a notice will appear:

Sadly, it’s not a hyperlink, but if you look down at the bottom of the editor, you’ll find a direct link to the Chromium Code Review site, where you can find the created change. After the CL is prepared, you can add reviewers for a code review, ask anyone with Try Permissions to run your change through the bots, and otherwise follow the process for contributing to Chromium.

If you need to modify a change after you’ve created a CL, you can do so using the Edit link on the Code Review Site. Push the button:

… then use the new commands down near the file list to modify (or add) files in the CL:

A few observations from this process:

1. A lot of Chromium GoodFirstBug‘s are much more complicated than they appear. This one required a followup CL to remove 400 more lines!

2. This new web-editing workflow is great for trivial fixes, but very limited. Most importantly, if you need to use any advanced tools (e.g. source formatting, manual code generators, presubmit checks, etc), you’ll need to download your CL from the code review site to use the tools on it.

3. Multi-file changes are challenging. It would be awesome to be able to just click “Edit Code” from the Chrome Source Viewer on multiple files and have them all open in the same “in-progress” change set, but it doesn’t seem to work like that (yet?). You must manually find all files after the first one in the editor’s sidebar.

I’m excited to see how Chromium’s Edit Code feature evolves.

-Eric

PS: When making downstream changes to Microsoft Edge, our internal process is somewhat similar, but this flow is a bit less intuitive. The biggest stumbling block is that when you go to commit, AzDO will complain TF401027: You need the Git 'CreateBranch' permission. To fix this, you need to name your branch with a prefix of “user/“, e.g. user/ericlaw/remove-old-policy. You’ll likely need to find a suitable reviewer by looking at MSOwners files (~replicating git ms owners) or by looking at file history to see who else touched it. You will also need a Proof-of-Presence YubiKey token (or ask a reviewer to use theirs) to land the change.

Client Certificates and Logout

Last Updated May 16, 2022

Back in May 2020, I wrote about Client Certificate Authentication, a mechanism that allows websites to strongly validate the identity of their visitors using certificates presented by the visitor’s browser.

One significant limitation for client certificate authentication is that there is no standards-based mechanism for a user to “log out” of a site that uses that auth mechanism.

Update: “Forget” feature in Edge 102

The Edge team is now testing a feature (which will likely be available by default starting in Edge 102) to allow the user to “forget” which Client Certificate was selected.

Background on Auth Caching

When a user picks a client certificate to authenticate to a server, that choice (an {Origin, ClientCert} tuple) is remembered for the lifetime of the browsing session. Any subsequent CertificateRequest challenge from that origin will automatically be answered by the browser using the previously-selected certificate.

The Auth Caching behavior is necessary for at least two reasons:

  • User-Experience: Client Cert authentication is a connection-oriented authentication protocol– each connection to the server can challenge the user for a client certificate, and the browser re-prompting the user for a new certificate for each new connection would be incredibly annoying.
  • Predictability: Even worse, if the user accidentally picked a different certificate for subsequent connections, the browser would end up in the very confusing state whereby requests might exhibit different behavior based on which reused connection happened to be pulled from the browser’s connection reuse pool when each request is sent.

Unfortunately, tying the Auth cache’s certificate selection to the browsing session means that if a user has multiple certificates, selecting a different certificate for subsequent use on the site (either because the user chose the “wrong” certificate the first time, or because they would like to “switch their identity”) is not generally straightforward.

The only option that works reliably across browsers is to restart the browser entirely (closing all of your other tabs and web applications). Note: You might reasonably expect that closing all of the tabs in a single Profile, then opening a new window in that Profile would be sufficient to clear the certificate selection, but as of Chromium 93, it is not enough– you must fully restart the browser to clear cached Client Certificates and HTTP Auth (e.g. Basic).

Update: This appears to have been improved in Chrome 97, where a new flag was introduced; it’s currently only enabled at 10% but will eventually roll out everywhere.

// Destroy profiles when their last browser window is closed, instead of when
// the browser exits.
const base::Feature kDestroyProfileOnBrowserClose{
    "DestroyProfileOnBrowserClose", base::FEATURE_DISABLED_BY_DEFAULT};

After enabling this FEATURE, closing the last window of a profile successfully clears its certificate selections and Basic auth cache, such that the user is prompted again upon reopening a window in the closed profile.

Log Out Approaches

To address the user desire to “Log out without restarting,” Internet Explorer offered a “Clear SSL State” button buried inside the Internet Control Panel:

… and websites could invoke the same functionality with a web-accessible JavaScript call:

 document.execCommand("ClearAuthenticationCache", false);

Notably, the button and the API both clear all Client Certificates for all sites running in the current session, meaning users cannot log out of just a single site using the API.

The ClearAuthenticationCache API (a blunt hammer with many side-effects) was never standardized, so it was not supported in other browsers.

Instead, the standardized Clear Site Data (MDN) offers a mechanism for websites to programmatically clear per-origin data including Auth Caches (both HTTP Authentication and Client Certificate Authentication). Unlike the IE ClearAuthenticationCache call, Clear-Site-Data is per-origin, so calling it does not blow every site’s data away.

Unfortunately, it’s not very useful for logging users out of Client Cert auth’d sites, for a few reasons:

  1. Websites cannot clear only Auth caches– the Auth caches are instead cleared when the website indicates that it would like cookies cleared.
  2. Websites cannot clear only Session data– when you request that cookies be cleared, it clears not only the Auth caches and session cookies, but also clears the origin’s persistent cookies.
  3. Clearing the Auth Cache alone isn’t enough– the browser also must clear/close any authenticated connections to the origin from the reuse pool, because otherwise a request might reuse a connection previously authenticated with a client certificate.

    The complexity and side-effects of this requirement mean that Chromium has not implemented the clearing of the Auth cache when Clear-Site-Data is called.

Chromium also does not offer any UI mechanism to clear auth caches, meaning that users must restart their browser to clear the auth cache and select different credentials.

Sessions vs. Profiles

Beyond the Clear SSL State button and ClearAuthenticationCache API, Internet Explorer offered users a New Session command that allows a user to open a new browser window that runs in a different Session than the original — the new browser window’s Session does not share Session state (the auth cache, session cookies, sessionStorage) with the original Session. The new Session does however share persistent state (persistent cookies, localStorage, the HTTP Cache, etc), so the two Sessions are not fully isolated from one another.

In contrast, Chromium does not offer such a “New Session” feature. Users can have a maximum of two active Sessions per profile— their “main” Session, and one Private Mode (“Incognito”) session. If a user wishes to have more than two Sessions active at a time, they must load the site using multiple Browser Profiles.

By many measures, this design is “better”– using a different Profile means that all state is isolated between the instances, so you won’t have localStorage, indexedDB data, persistent cookies, or HTTP cache information cross-contaminating your different browser sessions. You’ll also have a handy Profile Avatar in your browser UI to remind you of which account you’re supposed to be using for each window.

However, to an end-user, using different profiles might be less convenient, because profiles isolate all state, not just web platform state. That means that Favorites, Extensions, History and other useful application state are not shared between the two Profiles.

Can anything be done?

There are a variety of investments we might consider to address this use case:

  1. Enhance Chromium’s Clear Site Data feature to match the spec. (The fact that this got punted in Chromium suggests that it’s a hard problem)
  2. Offer the user an explicit mechanism in the browser UI to clear an origin’s Auth cache and empty its connection-reuse pool. (Users will have to learn the new mechanic) Update: This is what we did in Edge 102, see at top
  3. Try to be clever and clear the Auth cache when the user closes the last top-level browser tab to an origin. This is not quite as crazy as it sounds; there have been some discussions of this approach to address the problem of undead session cookies. (Tricky to implement this without undesirable side effects)
  4. Implement something like Firefox Containers to allow one Browser Profile to contain multiple isolated Web Platform-level sessions/profiles. (Expensive, Complicated, Users will have to learn the new mechanic)
  5. The clever and simple solution for this longstanding problem that I simply haven’t thought of yet.

Given the relative obscurity of this scenario, I’m hoping #5 turns up. :)

-Eric

Bonus Content: PINs

One additional behavioral change between IE/Edge Legacy and the new Edge concerns SmartCards whose private keys are protected by a PIN.

Windows typically caches a user-entered PIN on a per-process basis.

In the old model, each tab’s content process contained its own instance of the network stack which was responsible for selection of the certificate (and obtaining the user’s PIN, if required). This means each individual tab would prompt the user for their SmartCard PIN.

In the new model, it’s the browser process that accesses the SmartCard to obtain a selected client certificate, which means that the user is prompted for their PIN only once per browsing session.

Web “Sessions” in Private Mode

I’ve written about Private Browsing Mode a lot previously, and I’ve written a bit about the behavior of “Session restore” previously, but one topic I haven’t covered is how “Sessions” work while in Private mode.

Session Sharing

Historically, one of the top-reported Private Mode issues was that users unexpectedly found that opening a new Private window showed that they were already logged into some site they had used earlier.

From one example issue: The typical explanation when users report issues like this is that the user has multiple Incognito windows open and does not realize that fact. Incognito windows (perhaps surprisingly) are not isolated from one another, and closing one Incognito window does not end the Incognito session. The “background” Incognito window hangs on to all of the login tokens and when you open a new Incognito window, all of those tokens remain available in that new window. Only when all Incognito windows are closed is the session ended and the login tokens expired.

To address this, back in 2018 Chromium implemented an Incognito Window Counter to help the user understand when there are multiple windows in a single Incognito Browsing Session:

If there’s a number in parentheses after the “InPrivate” text, it means that there are more InPrivate windows open in the background. You’ll need to close all of them to end the InPrivate session.

Can We Isolate Each Private Window?

> Cant we just provide a real InPrivate window every time one is
> opened regardless of whether one is open or not already?? 

Offering “N-isolated InPrivate Windows” (Issue 1024731) is an occasionally-requested feature, but satisfying it would have some tricky subtleties.

In theory, yes, software’s just bits and we can code them any way we want—IE8 exposed an explicit “New Session” command, for instance. So we could make it such that every invocation of “New InPrivate Window” creates a new and isolated Web Session.

Implementing “N-isolated InPrivate windows” has two significant hurdles:

  1. Code – Chromium is presently designed with the idea that there’s a maximum of one InPrivate session per profile. We’d have to carefully trace through every use of the active Profile to create new partitions supporting “N-isolated InPrivate Sessions”, and figure out how UX features like tearing tabs out from an isolated window ought to behave.
  2. UX – Users might not really want every InPrivate window to be isolated from every other InPrivate window. For instance, if you have a website InPrivate and it opens a popup, you probably need that popup to be in the same Session as the parent window, or the flow (script access, any login cookies, etc) is going to break. In a world of “N-isolated InPrivate Sessions”, if you don’t bind the Session tightly to the window, you need to find some way to allow the user to distinguish which windows belong to which Sessions (to ensure, for instance, that closing the last InPrivate window in that isolated Session cleans up exactly the expected state).

Now, in a world of tabbed browsing where most site-initiated popups are automatically created as new tabs in the same window, perhaps we could just punt on the hard UX challenges and decree that every top-level InPrivate Window is isolated to only itself (and e.g. forbid tearing tabs out of that window). It’s hard to say whether the total cost of such a feature would justify the user-perceived benefit.


Rather than using InPrivate for all scenarios, you might also choose to create extra “ephemeral” profiles that throw away all cookies/cache/credentials/etc every time they’re closed, or you can use the existing-by-default “Guest” account for the same purpose.

-E

PS: Long ago, I built a Web Sessions test page in case you’d like to explore the behavior described in this post.

Images Keeping You Awake?

A Microsoft Edge user recently complained that her screensaver was no longer activating after the expected delay, and she thought that this might be related to her browser.

It was, in a way.

To troubleshoot issues where your PC’s screensaver and power-saving options aren’t working correctly, you can use the Power Config command line tool. From an command prompt running as Administrator, run powercfg /requests to see the list of applications requesting that your device keep the display active.

In this case, we see that MSEdge.exe and Teams.exe have active Display Requests. These requests tell Windows that the application wants the screen to remain active and unlocked, usually to display important content (in this case, an ongoing video call and a video playing on a visible tab in Edge, respectively).

After ending my Teams call, only the Edge lock remains. But I don’t think I’m playing any video. What’s up with that?

In Chrome or Edge, you can visit chrome://media-internals to see the list of video content that’s currently playing:

In this case, we see that my Twitter feed is playing back a video. Using the F12 Developer Tools to investigate, we see that (for performance reasons) Twitter serves their animated “GIFs” using MP4 video files:

… and this playback is what’s preventing my screen from going to sleep. Unfortunately, at present there does not appear to be any mechanism for a video tag to indicate that it does not contain important content that requires the display remain active. One proposal is that, for performance reasons, browsers should allow image elements to use video sources <img src="a.mp4" /> and render them as they render animated GIF/PNG today (e.g. no playback controls, allow display to sleep).

Unfortunately, for an end-user there’s not a good workaround for the problem, short of directing Windows to ignore Display Requests from the browser entirely.

-Eric

PS: Beyond media playback, another browser feature that can keep your screen alive is the Screen Wake Lock API, or screencapturing.

File Downloads will allow the screen to turn off, but Chromium will request that the system itself stay awake so that the download will not be interrupted in the middle:

WebRTC connections and file uploads also set an Execution wake lock.

Debugging Browsers – Tools and Techniques

Last update: November 14, 2023

Earlier this year, I shared a post on how you can become an expert on web browsers from the comfort of your desk… or anywhere else you have an internet connection. In that post, I mostly covered how to search through the source, review issue reports, and find design documentation. I also provided a long list of browser experts you might consider following on Twitter.

In today’s post, I’d like to give a quick summary of some of the tools and techniques I use for diagnosing browser problems.

The Importance of Observation

Specs lie. Code misleads. Everything changes over time. Observation reveals what’s actually going on– not what the PM designed, or the Dev intended. If you want to know how something is going to behave, just try it!

This image has an empty alt attribute; its file name is image-16.png

It ain’t what you don’t know that gets you into trouble. It’s what you know for sure that just ain’t so. -various

In many cases, the fastest route to troubleshoot problems is to observe exactly what is happening on the network, disk, or screen and only then start looking at code and specs to figure out why.

Built-in Tools

The F12 Developer Tools (just hit F12) are tremendously useful for determining why a given website behaves in a certain way. In many cases, the DevTools Console will flag an observed problem with a helpful error message. I don’t know of a great tutorial, but there are likely some on YouTube. One non-obvious feature of the DevTools is that you can use a Desktop browser’s DevTools to remote debug a browser running on a mobile device. Another fun fact is that you can use DevTools to debug themselves and some other browser UI.

Chromium’s NetLogs (see chrome://net-export ) contain tons of detailed information about almost every aspect of networking, as well as other useful diagnostic data (the user’s enabled extensions, field trial experimental settings, etc). You can analyze NetLogs using a variety of free tools.

Chromium Tracing (see chrome://tracing ) allows you to diagnose performance issues in Chromium-based browsers using extremely in-depth tracelog data. Analysis of these logs isn’t for the faint-of-heart.

Chromium Histograms (see chrome://histograms) enables you to see events logged by Chromium to be sent to the browser vendor for analysis and detection of problems. For example, when troubleshooting missing cookies, you might look at the Histograms page to see if there’s a Cookie.LoadProblem value indicating that the Cookie database file failed to load, or the OSCrypt values to see whether there was a problem loading the decryption key for that database.

Chromium Logging (using the --enable-logging command line argument) is useful in diagnosing a number of internal issues in Chromium subsystems. Collecting and analyzing these logs is non-trivial, but is sometimes the fastest way to root-cause tricky problems. See the following resources:

Chromium includes over 20 Internals Pages that allow you to view detailed information about media playback, data sync, and other features. Visit chrome://chrome-urls and search for -internals to see the list.

Browser Extensions

The VisBug Chrome Extension – Easily manipulate any page layout, directly in your browser.

postMessage Debugger – This extension prints messages sent with postMessage to the console.

Extension source viewer – View the source of browser extensions directly from the Web Store listing.

Cross-Platform Tools

WireShark allows packet-level analysis of network traffic. This can be useful in rare cases where a network bug depends on the exact packet size and timing.

The Fiddler Web Debugger allows import of NetLog and HAR traffic captures, and enables losslessly capturing requests and responses from any browser. While Fiddler Classic is (effectively) Windows-only, Fiddler Everywhere runs on Windows, Mac, and Linux.

Windows Tools

If you need to watch file or registry key creation/read/write/deletion, or thread/process creations and exits, then Sysinternals Process Monitor has got your back. For instance, this helped us easily root cause a bug where launching a Chromium-based browser would delete a file owned by Chrome.

If you want to explore information about process sandboxing, startup parameters, Job limits, etc, then Sysinternals Process Explorer is the tool to use. For instance, this helped us track down a problem where a browser window was unexpectedly appearing. The user simply closed all browser instances, then waited for an unexpected browser to appear. Then, they looked at the process tree to see what application started it. For instance, in this case, Edge was launched by sr.exe:

If you need to debug a scenario involving drag/drop or copy/paste, you can use ClipSpy (binary only) or NirSoft InsideClipboard.

Bisecting

Bisecting is the process of making a repeated set of observations to determine the build in which a problem appeared (or disappeared). From there, you can easily assign bugs to the right owners for rapid fixes.

See the Bisect Regressions section of this post for details on how to use Chromium’s bisect-builds.py script (which does not require you to build Chromium or download all of its tools and source code) to bisect problems. Here’s another bisection case-study.

I’m sure there are a hundred great tools I’ve omitted. This post will grow over time. If you’ve got a suggestion for a great diagnostic tool, share with us!

-Eric