On a flight back from Redmond last week, I finally read Linus Torvalds’ 2002 memoir “Just For Fun.” I really enjoyed its picture of Linux (and Torvalds) early in its success, with different chapters varyingly swooning that Linux had 12 or 25 million users. But more than that, I enjoyed some of the “behind the scenes” of a world-famous project that started out small before growing out-of-control.
Twenty years ago, I released the first builds of Fiddler, an app I’d begun as a side project while working on the clipart feature team in Microsoft Office. Originally, the idea was to build a debugger for the client/server communications between the Office client applications and the clipart download website. To put it mildly, the project was much more successful than I would’ve ever hoped (or believed) back then. More than anything else, Fiddler was a learning experience for me — when I started, I knew neither HTTP nor C#, so setting out to build a Web Debugger in .NET was quite an ambitious undertaking.
By the time I’d finished officially working on the project, Fiddler and its related projects amounted to perhaps 40000 of lines of code. But that’s misleading– over the years, I probably wrote at least five times as many, constantly rewriting and refactoring as I learned more (and as the .NET Framework grew more powerful over the twelve years Fiddler was under my control). I learned a huge amount while building Fiddler, mostly by making mistakes and then learning from them.
In today’s post, I’d like to summarize some of the mistakes I made in writing Fiddler (big and small) — the sorts of things I’d tell my earlier self if I ever manage to build that time machine. I’ll also talk about some things that went unexpectedly well, and decisions where even now, I couldn’t say whether a different choice would’ve led to a better outcome. Some of these are technical (only of interest to geeks), and some may be interesting for other audiences.
While personal experience tends to be the most vivid teacher, learning from the mistakes of others tends to be more efficient.
The Mistakes
I made a huge number of mistakes while building Fiddler, but I was fast to correct the majority when I became aware of them. The mistakes that were the hardest (or effectively impossible) to fix still linger today.
Collaboration
The core mistake I made with Fiddler was spending the first years thinking about it endlessly, without doing much talking about it. Had I spent more time talking to more experienced developers, I could have avoided most of the big technical mistakes I made. Similarly, had I talked to my few friends in the startup/business community, I would’ve been much more prepared for Fiddler’s eventual sale.
Still, I know I’m being a bit hard on myself here– twenty years ago, it wasn’t clear that Fiddler was really going to amount to more than “Just another side project”– one of a dozen or so I had cooking at any given time.
Threading
When Fiddler was first built, I knew that it needed to do a lot of work in parallel, so I quickly settled upon a model that used a thread per request. When Fiddler received a new connection from a client, it would spawn a new thread and that thread would read the request headers and body, perform any necessary modifications, lookup the target site’s address in DNS, connect to that address, secure the connection with HTTPS, resend the client’s request, read the response headers and body from the server, perform any necessary modifications, and return that response to the client. The thread would then either wait for another request on the client’s connection, or self-destruct if the connection was closed. As you can see, that’s a huge stream of work, and we want it to happen as fast as possible, so I naively assumed that the simplicity of the thread-per-connection would provide the best performance.
What I didn’t realize for a few years, however, is that virtually all of those operations involve a huge amount of “waiting around” — waiting for the network stack to send the full request from the client, waiting to resolve the hostname in DNS, waiting for the connection to the server, waiting for the server to return content, waiting for the client to read the response from Fiddler, and so much more. Taken as a whole, it’s a huge amount of waiting. I didn’t realize this for years, however, and didn’t look closely at the various much more complicated asynchronous programming paradigms added to the .NET Framework over the years. “Why would I want all of that complexity?” I wondered.
Eventually, I learned. I noticed that projects like the .NET Kestrel web server are built entirely around cutting-edge asynchronous programming concepts. While Fiddler would slow to a crawl with a few dozen simultaneous connections, Kestrel started at tens of thousands per second and only got faster from there. When I starting looking closer at Fiddler’s thread performance, I found a huge regression I’d introduced without noticing for years: Early in Fiddler’s development, I’d switched from creating an entirely new thread to using the .NET thread pool. In the abstract, this is better, but I never noticed that when the thread pool was out of threads, the Framework’s code deliberately would wait 500 milliseconds before adding a new thread. This meant that after Fiddler had around 30 connections active, every subsequent new connection was deliberately delayed. Ouch!
Unfortunately, Fiddler’s extensibility model was such that it wouldn’t’ve been possible to completely rewrite it to use .NET’s asynchronous patterns, although from 2014 to 2016, I gradually coaxed the implementation toward those patterns where possible. In the course of doing so, I learned a huge amount about the magic of async/await and how it works under the covers.
Simple Fields
I started building Fiddler (before I knew almost any C# at all) by defining the basic objects: HTTP headers, a Request object, a Response object, a Proxy object, a Connection object, and so forth. In many cases, I exposed data as public fields on each object rather than wrapping fields in C# Properties, reasoning that for most things, Properties represented unnecessary indirection and overhead, and remember, I wanted Fiddler to be fast.
It was quite a few years before I realized the error of my ways– while Properties do, in fact, introduce overhead, it’s the cheap kind of overhead. Many of the optimizations (performance and developer experience) I’d’ve liked to have made to Fiddler in later years were precluded by the need to preserve compatibility– converting fields to properties is a breaking change.
By far, the biggest mistake was exposing the HTTP body data as a simple byte[] field on the request and response objects. While plain byte arrays are conceptually easiest to understand, easy for me to implement, and convenient for extension and script authors, it was a disastrous choice. Many HTTP bodies are tiny, but a large percentage are over the 85kb threshold of .NET’s “Large Object Heap,” resulting in expensive garbage collection. The worst part is that a plain byte array requires contiguous memory, and this is disastrous in the constrained memory space of a 32bit process– after Fiddler ran for a while, address space fragmentation meant that Fiddler would be unable to store even modestly sized responses, triggering a flood of the dreaded “Out of memory” errors, requiring restart of the tool.

Fortunately, 64-bit processors eventually arrived to mitigate the worst of the pain. The address space for a 64bit process is so large that fragmentation no longer completely broke Fiddler, but even in 64bit, a segmented buffer would’ve improved performance and allowed for individual bodies over 4 gigabytes in size.
By the end, I fixed what I could without breaking compatibility. I introduced a bunch of accessor methods that would aim to “do the right thing” and tried to guide extension authors toward using those rather than accessing data fields directly.
SSL/TLS Stack
The original version of Fiddler supported only HTTP traffic. In 2003, this wasn’t a deal-breaker, because relatively few pages outside of online shopping checkout used HTTPS, and even there, secure transport was only sporadically supported. (To mess with HTTPS checkout pages, I had built an IE extension called TamperIE).
Helping matters, I soon discovered a way to get WinINET (the network stack underneath Office and Internet Explorer) to leak HTTPS headers to Fiddler. RPASpy was a DLL that exercised a long-defunct extensibility hook in the network stack (intended for CompuServe‘s Remote Passphrase Authentication) to send the headers to Fiddler. It was a huge hack, and read-only access to only WinINET’s headers alone wouldn’t satisfy every use case, but it was good enough for a while.
I knew that the “right” way to support HTTPS was to implement a TLS monster-in-the-middle, but directly calling into Windows’ SChannel or the open-source OpenSSL libraries seemed like a task well beyond my ability.
I didn’t end up adding proper HTTPS support until after .NET 2 was released. One day, I noticed that the Office Security team’s (unintentional) Fiddler-competitor “MiddleMan” tool now supported HTTPS. When I saw that, I quickly confirmed my hypothesis that .NET had wrapped SChannel (via the SslStream class) and I quickly added equivalent HTTPS-interception support to Fiddler. (The existence of MiddleMan was itself was something of a mistake. In 2004 or so, the Office Security team sent a broad status update suggesting they were going to build a HTTP debugger. I reached out and said I’d already built one, but that message was misinterpreted and ultimately ignored. However, Fiddler might not have ever escaped Microsoft had it become an “official” project, so perhaps things worked out for the best.)
In hindsight, I probably should’ve buckled down and wrapped OpenSSL directly, as this would’ve allowed Fiddler to support HTTPS earlier, and much more importantly, would’ve enabled additional scenarios. For example, a direct wrapper would’ve allowed Fiddler users to control low-level protocol details (like which ciphers are allowed) on a per-connection basis. Most importantly of all, years later the designers of the HTTP2 protocol decided to negotiate the use of that protocol via a TLS extension (ALPN) and .NET stubbornly refused to expose the capability of using that extension before I left Telerik and stopped working on Fiddler at the start of 2016. Fiddler Classic still doesn’t support HTTP2 to this day. Bummer!
Naming Things
When building a new app or platform, naming things is a crucial task; you want to move fast, but changing names later can be very disruptive and take years.
My app was named Fiddler because early on I had the vision that the proxy would have one big benefit over passive network monitors — the ability to rewrite network traffic, or “fiddle with it.” A secondary consideration was that, as the PM for the clipart team, I knew that there was plenty of free “fiddle” art I could use for the tool’s icon and splash screen. It was a few years before I learned that “fiddler” has an extremely unsavory association in some important English-speaking locales.
Fiddler’s objects were mostly easy to name, with easy ones (“Request”, “Response”, “headers”, “body”, “proxy”, “application”, “preferences”) and a handful of intuitive monikers like “Pipe” (a wrapper for a network connection), “Janitor” (an object that would purge expired data).
Perhaps the most important name, however, was the name of the key object that represented a request, its response, timing data, control flags, and other bits of information. I quickly settled upon Session, which was something of an unfortunate choice as there are so many different concepts of a Session in web networking, both on the browser side and the server side. Two decades later, I still sometimes find myself brainstorming better choices. To date, I think the leading contenders are Exchange (which would’ve been the runaway winner if not for a popular Microsoft server product of that name) or Pair (which suffers from the downside of being grossly imprecise, but the major benefits of relative uniqueness and being very easy to type over and over and over).
The Successes
With the biggest mistakes out of the way, let’s look at what went well.
C#
At the time I started writing Fiddler, I was at a “Hello World” level of skill in .NET, with nearly all of my projects written in Borland Delphi (Object Pascal). While I did mock up the very first Fiddler UI in Delphi, I committed to C# early on and learned the language as I built my app.
The C# team rapidly improved the language over the subsequent years (I like to credit my college roommate and long-time C# team member Anson Horton) and for the first few years every new release added awesome improvements (especially generics). Eventually, the C# team’s latest hotness was too much to keep up with (Linq, various async paradigms) and my desire to stay compatible with older frameworks meant that I couldn’t adopt everything, but C# continued to offer both compatibility and productivity improvements in each release. (In hindsight, I probably should’ve looked much closer at Linq, as it’s a very natural fit for many of the tasks that Fiddler scripters and extenders seek to accomplish).
If I were to start Fiddler over today, I’d probably look at building it in Go, which is a language extremely well-suited to building the sorts of high-scale networking code that Fiddler needs. One of my final projects at Google was building TrickUri, a simple cross-platform tool that offers some Fiddler-like functionality in under 400 lines of code.
Extensibility
Remember, Fiddler was designed as a clipart debugger. It only ended up with millions of users worldwide because it proved much more flexible than that, with both a scripting engine and an extensibility model that allowed for both rapid feature iteration and the ability for 3rd parties to extend the tool to support their own scenarios.
Ironically, Fiddler’s extensibility mostly came about due to my laziness! I knew that Fiddler needed a way for users to express filters for which traffic they wanted to see in the tool, and I set out to build a filter UI that looked like the filtering UI in Microsoft’s internal bug tracking tools (initially Raid, then Product Studio).
I quickly realized that the code to do this was going to be messy and hard to maintain. Doodling filter UIs on a notepad in the Visual Studio building after hours while Anson was playing ping pong with one of our friends, I thought “If only I could get my users to just write their own filtering code.” And then the epiphany: “Wait, didn’t I just see some MSDN Magazine article about adding a script engine to your .NET app?” Fiddler went from a niche clipart debugging tool to the only easily extensible proxy tool within a matter of days.
Unfortunately, the only language available was the relatively esoteric JScript.NET which was close enough to the JavaScript used by most of my target users to seem familiar, but different enough to be occasionally infuriating. Still, it worked amazingly well. My only big mistake here was failing to hunt around for JScript.NET resources — eight years later, I discovered that Justin Rogers (a future teammate on the IE browser) had written a whole book about JScript.NET, covering lots of material I had to laboriously work out on my own, and including some tidbits I hadn’t even learned in all those years.
Later, I expanded extensibility support from JScript.NET to any .NET language, allowing other C# developers and empowering folks coming from more esoteric languages (IronPython).
Fiddler would still be useful without rich extensibility (e.g. Telerik’s newer “Fiddler Everywhere” product isn’t extensible) but there’s no question that extensibility is a prime reason for Fiddler Classic’s popularity and longevity. While I haven’t had access to Fiddler’s source code in 9 years, even today I’m still able to broaden the capabilities of the tool by building upon its extensibility model (e.g. NetLogImport, NativeMessagingMeddler).
Preferences
I’ve long loved Firefox’s about:config mechanism– it’s an unobtrusive way to expose configuration knobs and switches that’s easy to use, easy to document, and easy for browser features to consume. While simple “Strings as configuration” has some clear downsides (versus, say, typed enumerations), I think the benefits (development ease, flexibility, documentability) make for a good tradeoff.
Adding a Preferences system to Fiddler in 2010 won the same benefits, and doing so correctly (in a heavily multithreaded and extensible tool) without introducing deadlocks or performance problems resulted in one of the few areas of Fiddler’s code of which I’m truly proud. An older (and probably buggy) version of the original code can be perused here. Type about:config in Fiddler’s QuickExec box to see the preferences.
The Book
Circa 2011, I began exploring the sale of Fiddler to an undisclosed company headquartered in the United Kingdom. My wife and I flew to visit the team and I watched with mounting alarm as I watched two of their product managers use the tool — it seemed like they’d found the most complicated, least efficient means of doing literally everything. They’d been studying Fiddler for a few months in researching the acquisition, and I was honestly shocked that they were even making an offer after seeing how clunky they made the tool look.
I immediately realized the problem — While Fiddler offered many powerful features and convenient shortcuts, there was really no way to learn about how to use it unless you’d seen me at a conference or watched one of the handful of short videos I’d put up on YouTube.
I resolved to write a book about the tool, starting out unimaginatively describing everything from the top-left to the bottom right. I got into a great routine– my wife was training for a marathon, so in the mornings she would go out to run and I would go to the coffee shop to write. Progress on the book was steady, but not as fast as I’d initially predicted. The problem was that I’d sit down and write three pages on how to accomplish some task, but writing prose served as a forcing function for me to really think deeply about the task. That, in turn, immediately caused me to think about how I could make the task easier (so I could reduce the pain of writing), and I would frequently go back to my dev box and code for half an hour to make the task require just the click of a button. And then I’d have to go replace my painstakingly-authored three pages with a single sentence: “To <accomplish goal>, push <that button>.” Fiddler improved rapidly, and I began describing this virtuous loop as book-driven development.

I did not expect to make any meaningful amount money on the book. I was pleasantly surprised to be wrong, eventually earning on the order of $250 per hour I spent on the first and second editions. The Second Edition is still for sale today, and still >95% accurate despite being almost nine years old.
In terms of mistakes — I probably should’ve started writing the book earlier, and I definitely should’ve created video training content for Fiddler. I had done so little research into the topic that it wasn’t until 2013 that I learned that Pluralsight video training publishers got paid for their content. I suspect I left quite a bit of money on the table. Oops. On the plus side, I later became a friend and collaborator to some great folks who filled that gap for me.
The Unknowns
There are some decisions that are hard to reason about– they could’ve made Fiddler dramatically more successful, or prevented it from achieving the success it did.
Win32 UI
When I first started working on Fiddler, the only real UI choice was WinForms, a .NET wrapper around the traditional Win32 UI. However, the .NET soon embarked on a variety of fancier UI frameworks and strongly evangelized those to developers. To avoid breaking compatibility with script and extensions, I never adopted any of the frameworks, and many of them eventually faded away.
Limiting Fiddler to WinForms was something of a double-edge sword — I would’ve been sad if I’d picked up a replacement that was later abandoned by Microsoft, but changing UI frameworks definitely would’ve been a forcing function to better decouple Fiddler’s engine from its UI, a process that I instead undertook much later in extracting the FiddlerCore engine. That decoupling, while belated, resulted in some significant improvements in Fiddler’s architecture that I wish had come earlier.
Perhaps most importantly, however, changing UI frameworks might have resulted in abstractions that would’ve made Fiddler more portable to other platforms.
Cross-Platform
When I first started work on Fiddler, Windows was far and away the most popular developer platform for the web and webservice-consuming client applications. Within a few years, however, Mac rocketed to the platform of choice for web developers, particularly in the US. The fact that Fiddler wasn’t available for Mac was a huge downside, and moving to support that platform represented a huge opportunity. Half-measures (e.g. pointing a Mac’s proxy settings at a Fiddler PC or VM) were just that — useful, but kludgy and annoying.
Fortunately for some, this gap meant that I didn’t completely destroy the market for Mac Web Debugger apps (“Free and good” is extremely hard to compete against), and it later gave potential acquirers an idea of how they might monetize their investment (“We’ll promise to keep Fiddler for Windows free forever, but sell the Mac version“).
When I joined Telerik, one of my first tasks was to see about getting Fiddler stood up on other platforms. Using the Mono framework, I quickly had a reasonably functional version of Fiddler running on Linux. The same code technically also ran on Mac, but the quality of the UI framework on Mac was so poor that the tool couldn’t do much more than boot before hanging or crashing. Still, getting Fiddler stood up on Linux was something of a win– it meant that Mac developers could run Fiddler inside a VirtualBox VM running Linux at no-cost.
Ultimately, supporting cross-platform would have entailed some crucial tradeoffs that are hard to reason about: Would a debugger that was worse (slower, less native) on every platform be more successful than a debugger that was great on only one platform? I still can’t answer that question.
Open-Source
One decision I’d made early on was to build Fiddler without using any open-source software (OSS). Microsoft had a complicated relationship with OSS in the early 2000s, and even looking at OSS code without using it risked concerns from the legal department.
My stance weakened in later years, and I did eventually use a variety of small OSS components (e.g. the Hex editor control, and a ZIP compression library) if they had a liberal (MIT) license. In some cases, I contributed back fixes I made to the OSS code I consumed, in others, I rewrote almost the whole thing.
Similarly, I didn’t make Fiddler itself OSS — as a practical matter, Github didn’t yet exist, and I had no idea how I might do open-source beyond just putting a ZIP file full of code up on my website. Combined with worries about Microsoft’s legal department, and skepticism that anyone else would need to contribute to Fiddler’s code (between the rich extensibility model, and how quickly I responded to users’ feature requests), I never seriously considered opening up Fiddler’s code to external contributions.
Today, I’m very sad that Fiddler isn’t open-source. Telerik has allowed Fiddler Classic to stagnate (with years between minor improvements), and there are many bugs that I (and others) could have easily fixed, and features we could have added… but we can’t because the code is closed-source.
As Fiddler’s community grew, several superstar users (Kevin Jones, Jerome Segura, and others) began doing amazing things with Fiddler’s extensibility model, and there’s no question that the tool would’ve been even more powerful if those and other collaborators could change the code directly.
Fiddler and My Microsoft Career
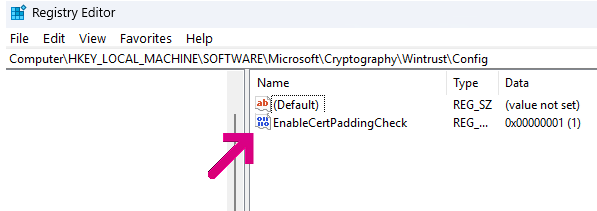
Not long after I started working on Fiddler, I started describing it as a “Microsoft PowerToy” with the notion that it would join the pantheon of (venerated but then defunct) useful applets built by Microsoft employees but not an “official” product in any way. At some point over the next year or two, I removed all mention of Microsoft in the UI (although to this day it remains in the registry path used by Fiddler) after deciding that such mention was more likely to cause trouble than prevent it. Still, I was always uneasy, knowing that if something bad happened (a serious security incident, a patent claim, etc), Microsoft seemed likely to simply fire me with no questions asked.
When I left the Office team to join the Internet Explorer team, I showed off the app to a few of my interviewers. My new manager Rob opined that they planned to keep me too busy for side-projects, so I should just hand Fiddler off to someone else in the company. “That’s one possibility” I thought to myself, guessing (correctly) that what actually happened is the same thing that happened in Office– every tester who saw Fiddler immediately added it to their toolbox and began using it to debug anything they could. Nevertheless, I embarked on a renewed effort to get someone in Visual Studio interested in the tool; a long mail thread went up to a VP who mused “We should look at more web debugging scenarios in the next version” and that was the last I’d ever heard from them.
However, some other folks in Visual Studio did take an interest, and a satellite team in North Carolina reached out to build some VS integration features for Fiddler, including a “Visual Studio .WebTest Generator” plugin that would use a Fiddler capture to build a test script from captured web traffic. I didn’t hear from them for a few months after our initial kickoff meeting, so I reached out to ask how things were going. Their Engineering Manager reported that they were going to start soon, but their project had been delayed because their prior project had been to build better multi-threaded debugging features for VS, and when they tried using those features on Fiddler itself, Fiddler’s massive and varied use of threads revealed tons of bugs in their tooling. So they had to go fix that first before getting back to extending Fiddler. Oops.
In 2007, I was encouraged to submit Fiddler to the prestigious company-wide Engineering Excellence awards, and won one of the prizes. Bill Gates handed me a big glass spike, and my team (me) got $5000 in morale money to spend. I ended up taking a Mediterranean cruise with my girlfriend (fiancée, by the time we got off the boat).

Around 2010, the IE team visited our Online Services teams in California to ask what they wanted in the next version of the IE developer tools. The feedback was overwhelming: “Just bake in Fiddler.” I was proud, but frustrated, knowing that doing so wouldn’t really be practical for a variety of technical and non-technical reasons.
Other than broad recognition, frequent kudos, the EE Award, and the satisfaction of knowing that I was helping a lot of my colleagues be more effective, Fiddler seemed to have almost no formal impact on my Microsoft career. More than once it was strongly implied that some saw Fiddler as a distraction from my “real” job, and it was proof that I could’ve been working harder on my official duties. It was an occasionally frustrating feeling, but mostly I ignored it.
Still, one of the great unknowns with Fiddler was what might’ve happened had I put more effort into trying to get Microsoft to recognize its impact and get it better integrated into some other product or initiative. Grass-roots usage inside the company neared the top of the charts, and folks at all levels of the organization were using it. (One of my proud moments was when Ray Ozzie mentioned that he was a user).

With more effort at collecting data and evangelizing the possibilities, could I have managed to move the organization to officially embrace Fiddler? Could I have become a successful architect of an important Microsoft platform? Or was my private theory at the time correct: Microsoft would never be interested in anything unless one day it would bring in a billion dollars?
Monetization
As Fiddler usage grew from a handful of friends and coworkers to peak at around 14000 daily downloads, a tantalizing possibility arose: could I turn Fiddler into a business and eventually a full-time job? I knew that the fact that the tool was freeware greatly boosted its popularity, and I knew that trying to charge for it would entail all sorts of hassles, including dealing with Microsoft’s legal department, a dreaded exercise that I had (to my increasing surprise) managed to avoid year after year. The fact that Fiddler was free and was a Windows-exclusive used by tens-of-thousands of Microsoft’s own employees always seemed like a useful hedge against any interference from the suits.
Still though, when the first acquisition offer for Fiddler came in, I sought advice from Lutz Roeder, who had a few years prior sold his .NET Reflector tool to a 3rd-party developer tools company. When I described my daily download metrics, he suggested that I ought to make Fiddler my full-time job. Around the same time, my own manager called me over to an office window to observe: “You’re an idiot. See that red Ferrari down there? As soon as you thought of Fiddler, you should’ve quit Microsoft and made us buy your company later.” I laughed and observed “Naw, Fiddler’s cool, but I’m no Mark Russinovich. That would’ve never happened.” I went on to explain how I’d previously tried to get the Visual Studio team to take more of an interest in Fiddler (for free), to relatively little effect.
Still, I pondered various moneymaking schemes: I wondered whether I should build a “Game Genie for the Web” tool that would allow non-experts to tweak (cheat) on web-based games, but ultimately concluded I’d probably have to spend all of the profits I’d earned on lawyers after game companies sued me.
I considered building a standalone tool called DIABLO (“Demo In A Box for Limited Offlining“) that would allow anyone to easy make their webservice work offline for demo purposes. This was a powerful use for Fiddler, because it meant you could demo your site or service without having to worry about your network connection. (For a few consecutive instances of the Annual Company Meeting at Safeco Field in Seattle, I noticed the Fiddler icon down in the system tray as various teams demo’d their latest wares.)
What I never did do, however, was ask people what sorts of features they would be willing to pay for.
With the benefit of hindsight, there are two clear directions I could’ve taken that would have supported a business: 1) automated testing of web applications (in 2014/2015, I eventually threw together some simple and powerful features in that vein), and 2) team-based collaboration features. The latter ended up being the direction taken by Postman, in 2012 a primitive tool that grew to a business with hundreds of employees, netting hundreds of millions in venture capital financing and a valuation in the billions of dollars a decade later. Oops.
Selling Fiddler
When the first offer came in from a developer tools company seeking to acquire Fiddler, it was very timely– Fiddler felt “pretty much done”, I’d recently been promoted to a Team Lead role, gotten married, and my wife and I were starting to think about having kids. Letting a famous devtools company take over Fiddler’s development seemed like a great outcome for both me and the overall Fiddler community. I knew that some users would howl at having to start paying for Fiddler, but reasoned that many would be happy to do so, and anyone who mistook me for a “Software should be free” zealot clearly wasn’t paying attention to my choice of employer.
Additionally, I’d always felt a little guilty after a friend came back from a conference trip to report “Karl von Randow (developer of the Charles debugger) isn’t exactly your greatest fan.” And it was an understandable feeling — by giving Fiddler away (while cashing my Microsoft paychecks), I was indeed (if unintentionally) hurting Karl’s business by implicitly socializing the notion that “$0 is a reasonable price for a great web debugger.“
I had anticipated a long and painful process to get Microsoft to agree to let me sell Fiddler, but my manager was both a genius and well-connected (formerly one of Bill Gates’ technical assistants) and it was a remarkably painless process to get the required sign-offs. Making matters easier were a few happy accidents: there was no Microsoft source code or secrets in Fiddler, there was no Fiddler source commingled into any of Microsoft’s products, and I had (coincidentally) never used Microsoft-owned hardware when developing Fiddler. Finally, because the plan was that the acquirer would buy Fiddler but leave me behind on my current team at Microsoft, my management chain had no objections.
Still, as I noted above, watching the would-be acquirer use my code in the clumsiest possible fashion set me on the path of writing the Fiddler book, and that work, in turn, reinvigorated my passion for the app. Instead of feeling like Fiddler was “pretty much done,” I started to see deficiencies everywhere. The idea of just handing the code off to another company felt… uncomfortable.
The notion of abandoning the sale was unpleasant — I didn’t want to disappoint the acquirer (whose friendly team I really liked), and I knew that my upcoming time pressures (between Microsoft and parenthood) would truly be a limiter in what I could achieve in the coming years. And, to be frank, walking away from the offer (~18 months of my salary) made me gulp a little.
So, it was even more timely when Chris from Telerik finally got ahold of me on a rainy winter day in 2012; I’d just left the coffee shop in Redmond Town Center where I’d been working on the Fiddler book. Chris been trying to get me to agree to sign a more formal license agreement for FiddlerCore so they could use it in one of their products. I’d previously blew them off, but this time I noted “Well, I’m actually about to sell Fiddler, and I bet the new owners will have lawyers that can help you.” Chris immediately replied “Wait, wait, wait, if Fiddler’s for sale, we’re buying it.” In very short order, we had another call where he offered not only to buy Fiddler (at over double my existing offer), but also hire me at my current Microsoft salary to keep working on it. By moving to work at Telerik’s office in Austin, Texas, our family’s cost-of-living would drop significantly, and my wife and I could easily live on a single income. Win-Win-Win.
Shortly after I’d signed Telerik’s offer, I had lunch one snowy day with a friend who worked at a networking startup. He remarked that he was surprised that I’d sold to Telerik, casually dropping: “We’d’ve given you <3x Telerik’s offer> and you wouldn’t have even had to move.” I dismissed this as empty bluster until a few months later when their company was acquired for two billion dollars. Oops.
Still, happy enough with the Telerik offer, things moved fast, and by October 2012 my wife and I both resigned at Microsoft, packed up the cat, sold my car, and drove her car from Seattle to our new home in Austin. Nine months later, my first son was born.
Working for Telerik could fill a short book in itself, but that’s one I’m not going to write tonight.
Thanks for joining me for this trip down memory lane. I hope you can learn from some of my mistakes!
-Eric
PS: I’ve previously shared some of this history and my learnings in a conference talk. The “Lucking In” audio and slides are on Github.